


This is the fourth iteration of this exercise focused on 2024 sustainability disclosures. This edition includes an increased coverage of metrics in scope (e.g. data providers and additional restatement and target setting information). The FIs covered include the following:
- 26 Global Wholesale, Retail and Investment Banks.
- 21 Asset managers and Life insurance companies.
- Asset coverage totaling £25tn on balance sheet.
- Geographical reach spanning the UK, US, Europe, and Middle East.
The global reach reflects the increasing level of transparency of sustainability disclosures within the financial services sector.
The analysis primarily focuses on the carbon footprint metrics disclosed by the aforementioned FIs, specifically covering the lending activities of Banks and investment activities of Life Insurers & Asset Managers (i.e. financed emissions). Additional data is included regarding operational emissions, target setting, forecasting and sustainable finance activities.
Why is it important?
The sustainability reporting landscape continues to evolve rapidly amid heightened geopolitical tensions and a shifting regulatory environment. With frameworks such as TCFD, ISSB, CSRD, and Pillar 3 driving increasingly granular disclosures, financial institutions face growing scrutiny from regulators, investors, and internal stakeholders. In response, leading FIs—particularly G-SIBs with global operations—are revisiting their Target Operating Models to ensure they can meet divergent regional requirements at scale, with EMEA and APAC often setting the pace.
We are observing a divergence in approach: large, globally active Banks/FIs are investing in integrated, enterprise-wide emissions reporting structures, while smaller and regionally focused FIs are prioritising capability building and foundational data improvement. Robust financed emissions metrics are critical—not only to fulfil compliance obligations, but also to inform risk management (e.g. CP10/25, EBA guidelines), enable effective transition planning, identify balance sheet decarbonisation levers and guide balance sheet optimisation. A clear decarbonisation strategy can help institutions align disclosures with strategic priorities and unlock value across sustainability reporting, risk oversight, and net zero transformation.
Market trends & outcomes
We are observing a clear divergence in approach to financed emissions reporting: large, globally active FIs are investing in integrated, enterprise-wide reporting structures, while smaller and regionally focused FIs are prioritising capability building and foundational data improvements. This variation reflects differing levels of maturity and resource allocation, often leading to inconsistencies in sustainability disclosures and carbon footprint figures. Below, we outline key market trends and insights observed across the industry, structured around four critical pillars: disclosure, scope & assumptions, data, and target setting & decarbonisation strategy.
Explore key insights
1. Disclosure: Framing the reporting landscape
Despite existing guidance on scoping and measuring the carbon footprint of financial institutions' lending or investment activities, it is not always prescriptive and often requires judgment. This leads to variations in sustainability reports and carbon footprint figures. Our analysis highlights key findings and considerations for FIs, categorised into the four pillars below: disclosure, scope, data, and target setting and forecasting.
- Restatement becoming more prevalent with, 60% of FI restating a financed or operational emissions metric, driven by improved data quality, errors correction and evolving methodologies—highlighting the ongoing push for transparency and accuracy.
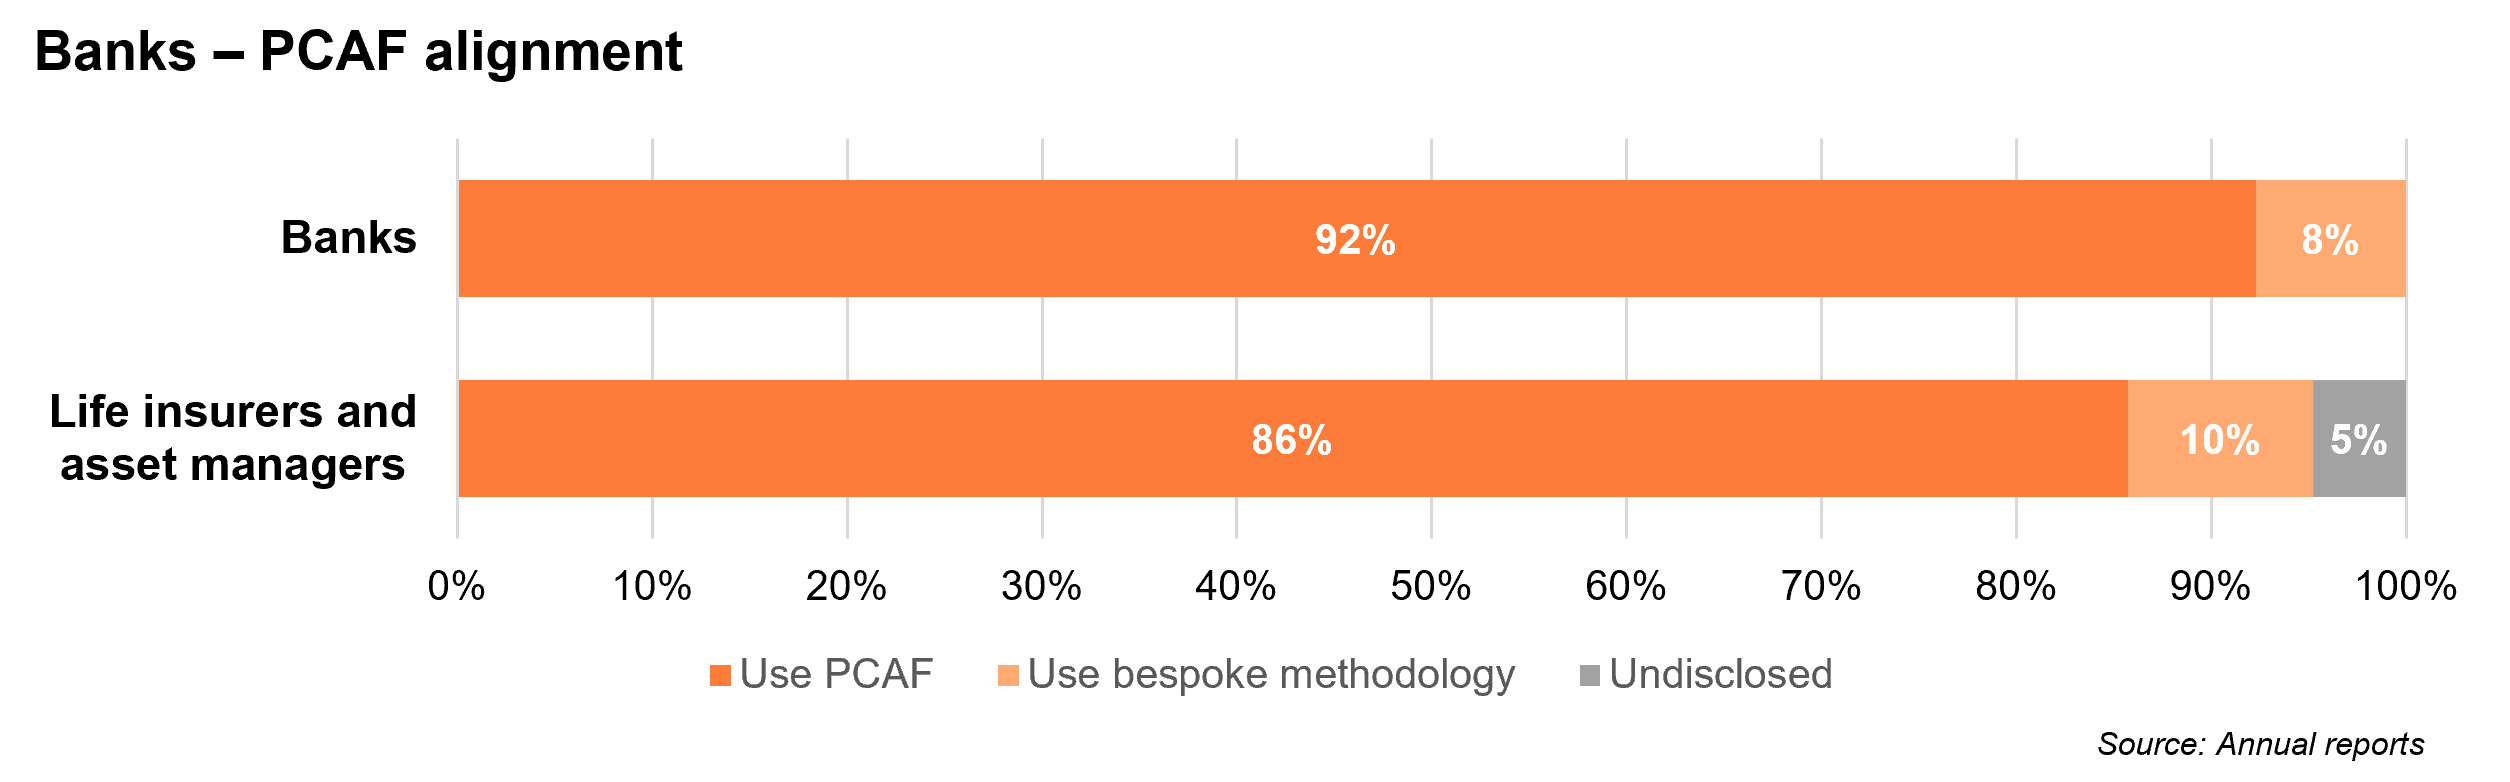
- PCAF is driving the financed emissions calculation landscaped, with 92% of Banks and 86% of Life Insurers & Asset Managers aligning their disclosures accordingly.
- Growing emphasis on external assurance to enhance credibility and meet emerging regulatory expectations such as those under CSRD and ISSB. 64% of participants engaged external assurance providers for emissions reporting—a figure expected to grow as regulatory requirements increasingly mandate third-party verification.
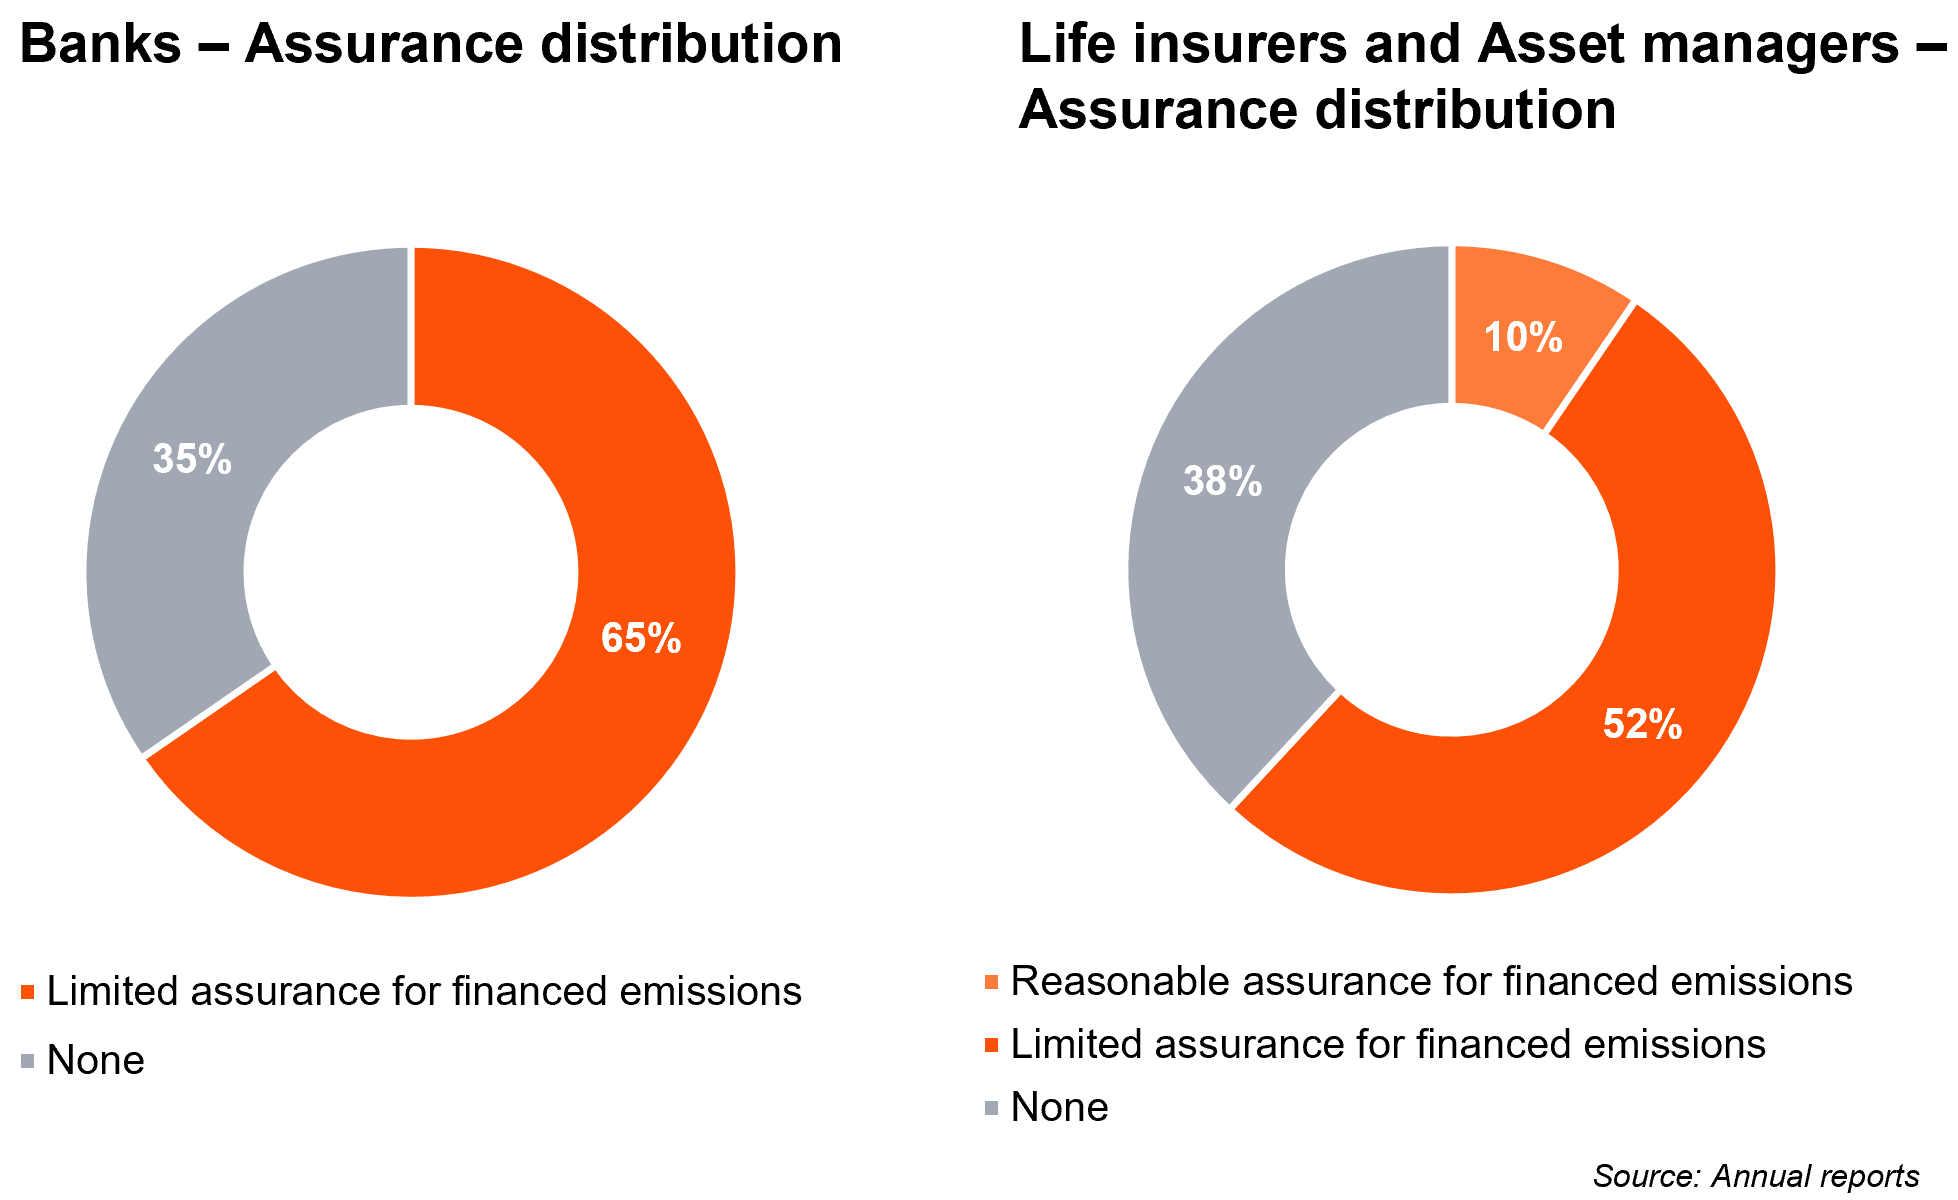
Assurance over emission disclosures
- On a combined basis 64% of the 47 FIs analysed have had at least limited assurance on the data underpinning their financed emissions disclosures (see more detail in graphs below for breakdown by FI). This varied from assurance of individual metrics to wider scopes covering a broader range of sustainability disclosures.
- Interestingly, 2 FIs requested reasonable assurance on their financed emissions, an increase from 1 in the YE23 Benchmark.
- The majority, that we observe, of institutions seeking external assurance is driven by a combination of voluntary motivations and regulatory requirements, such as those prescribed under the CSRD. This number is expected to grow in future years, as the second phase of CSRD brings more EU companies into scope.
Use of PCAF (Partnership for Carbon Accounting Financials)
- 92% of Banks and 86% of Life Insurers & Asset Managers included in the sample have calculated their financed emissions metrics in line with PCAF guidance. These proportions remain consistent with the YE 23 benchmark, however we have observed a slight increase in the number of Life Insurers & Asset Managers using bespoke methodology (2).
- All the Banks analysed have aligned with PCAF methodologies, with 2 exceptions that are leveraging in-house bespoke methodologies; One also provides PCAF-aligned calculations in their appendices for ease of comparison.
- 3 Life Insurers & Asset Managers did not disclose whether the calculation methodology used was bespoke or aligned to PCAF.
- Given the continually evolving and complex disclosure requirements and guidance we are commonly observing FIs disclosing/reporting under multiple frameworks.
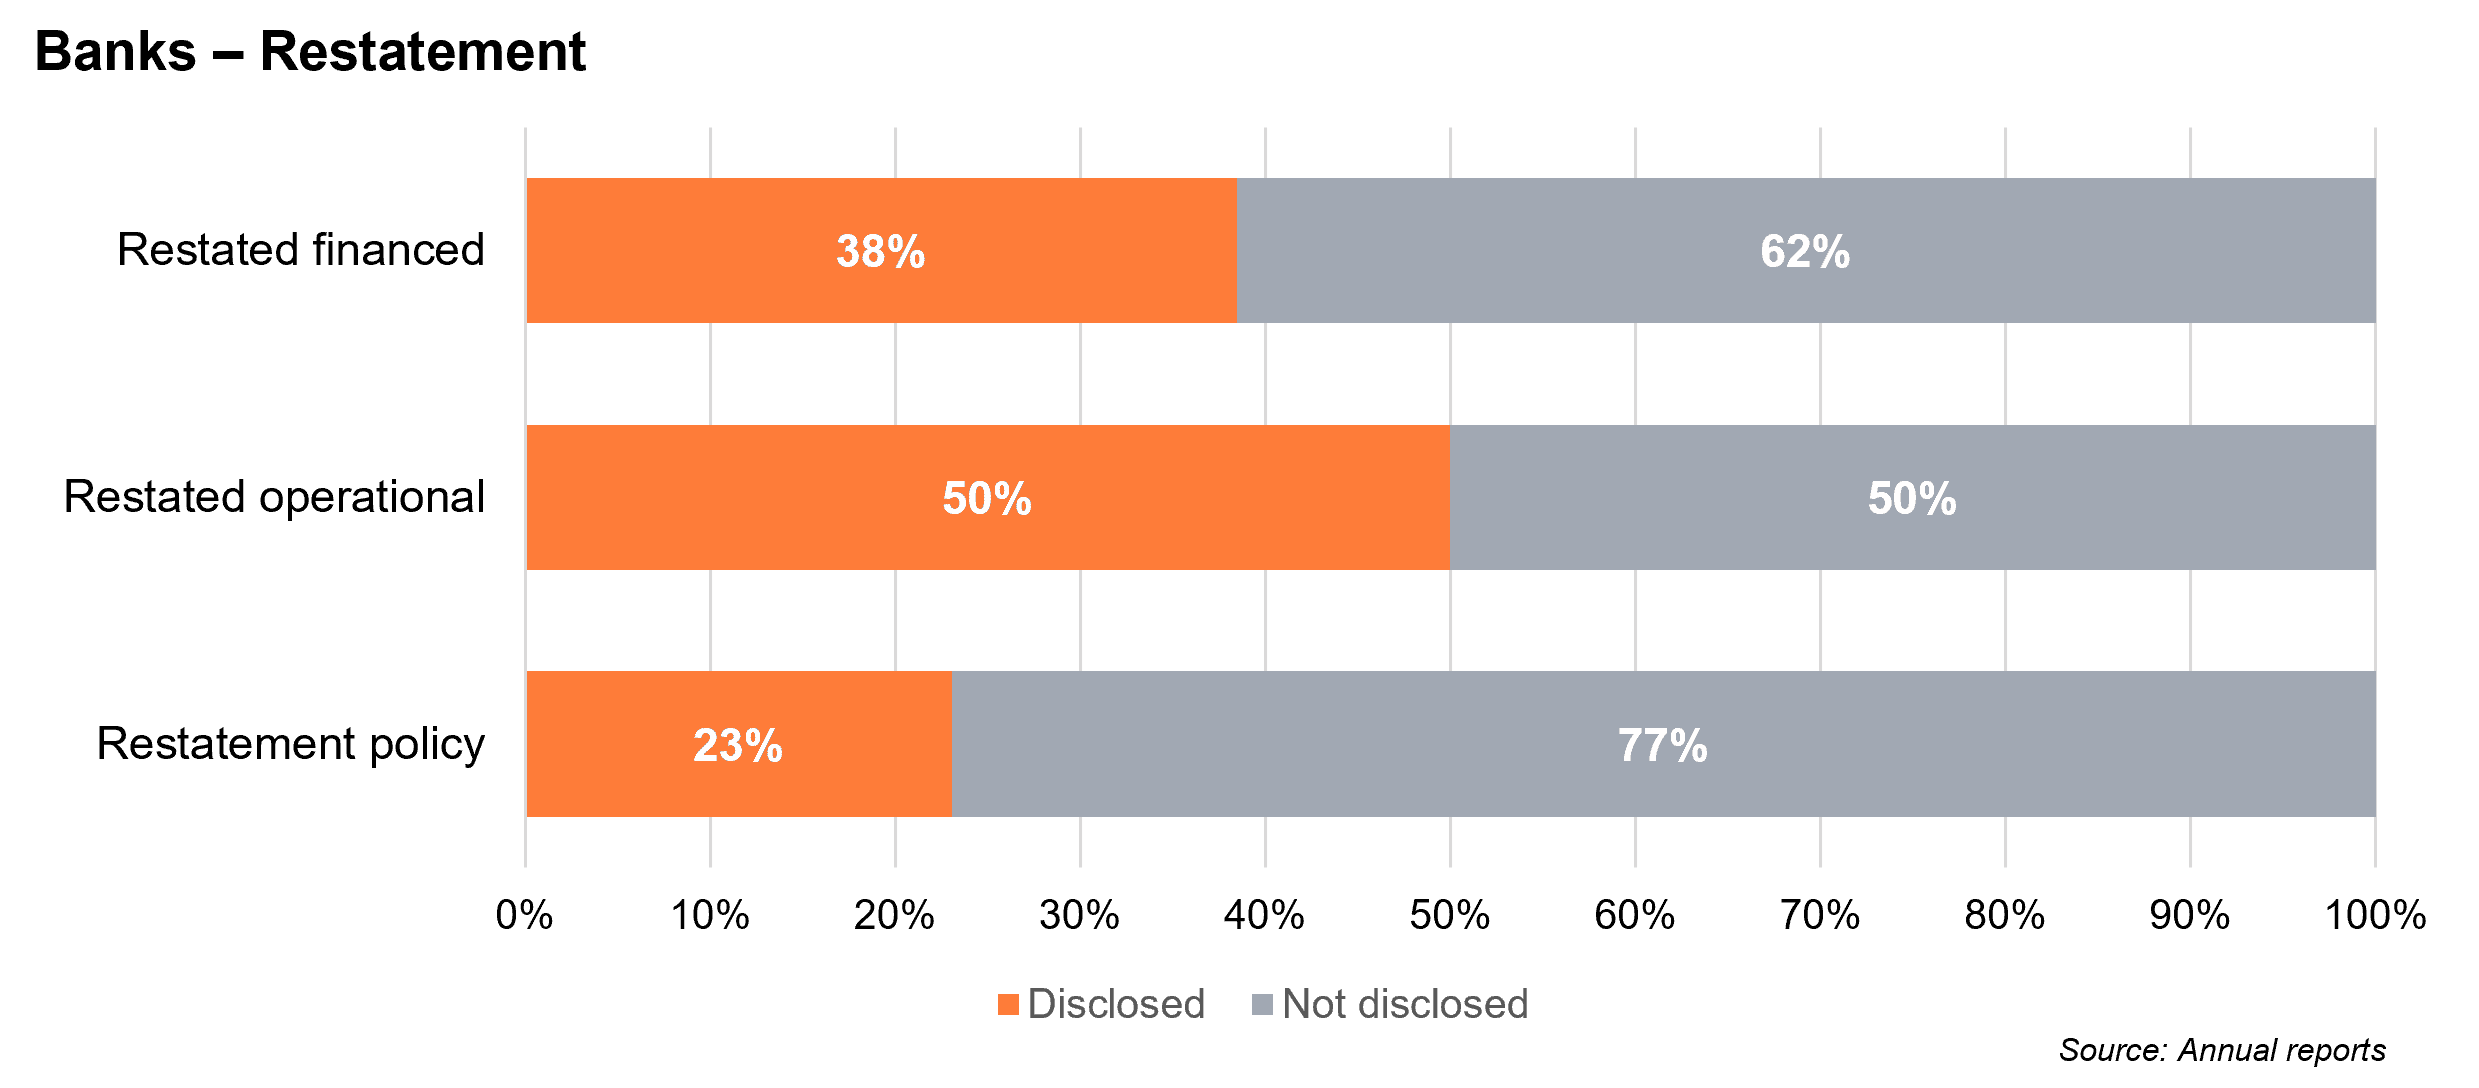
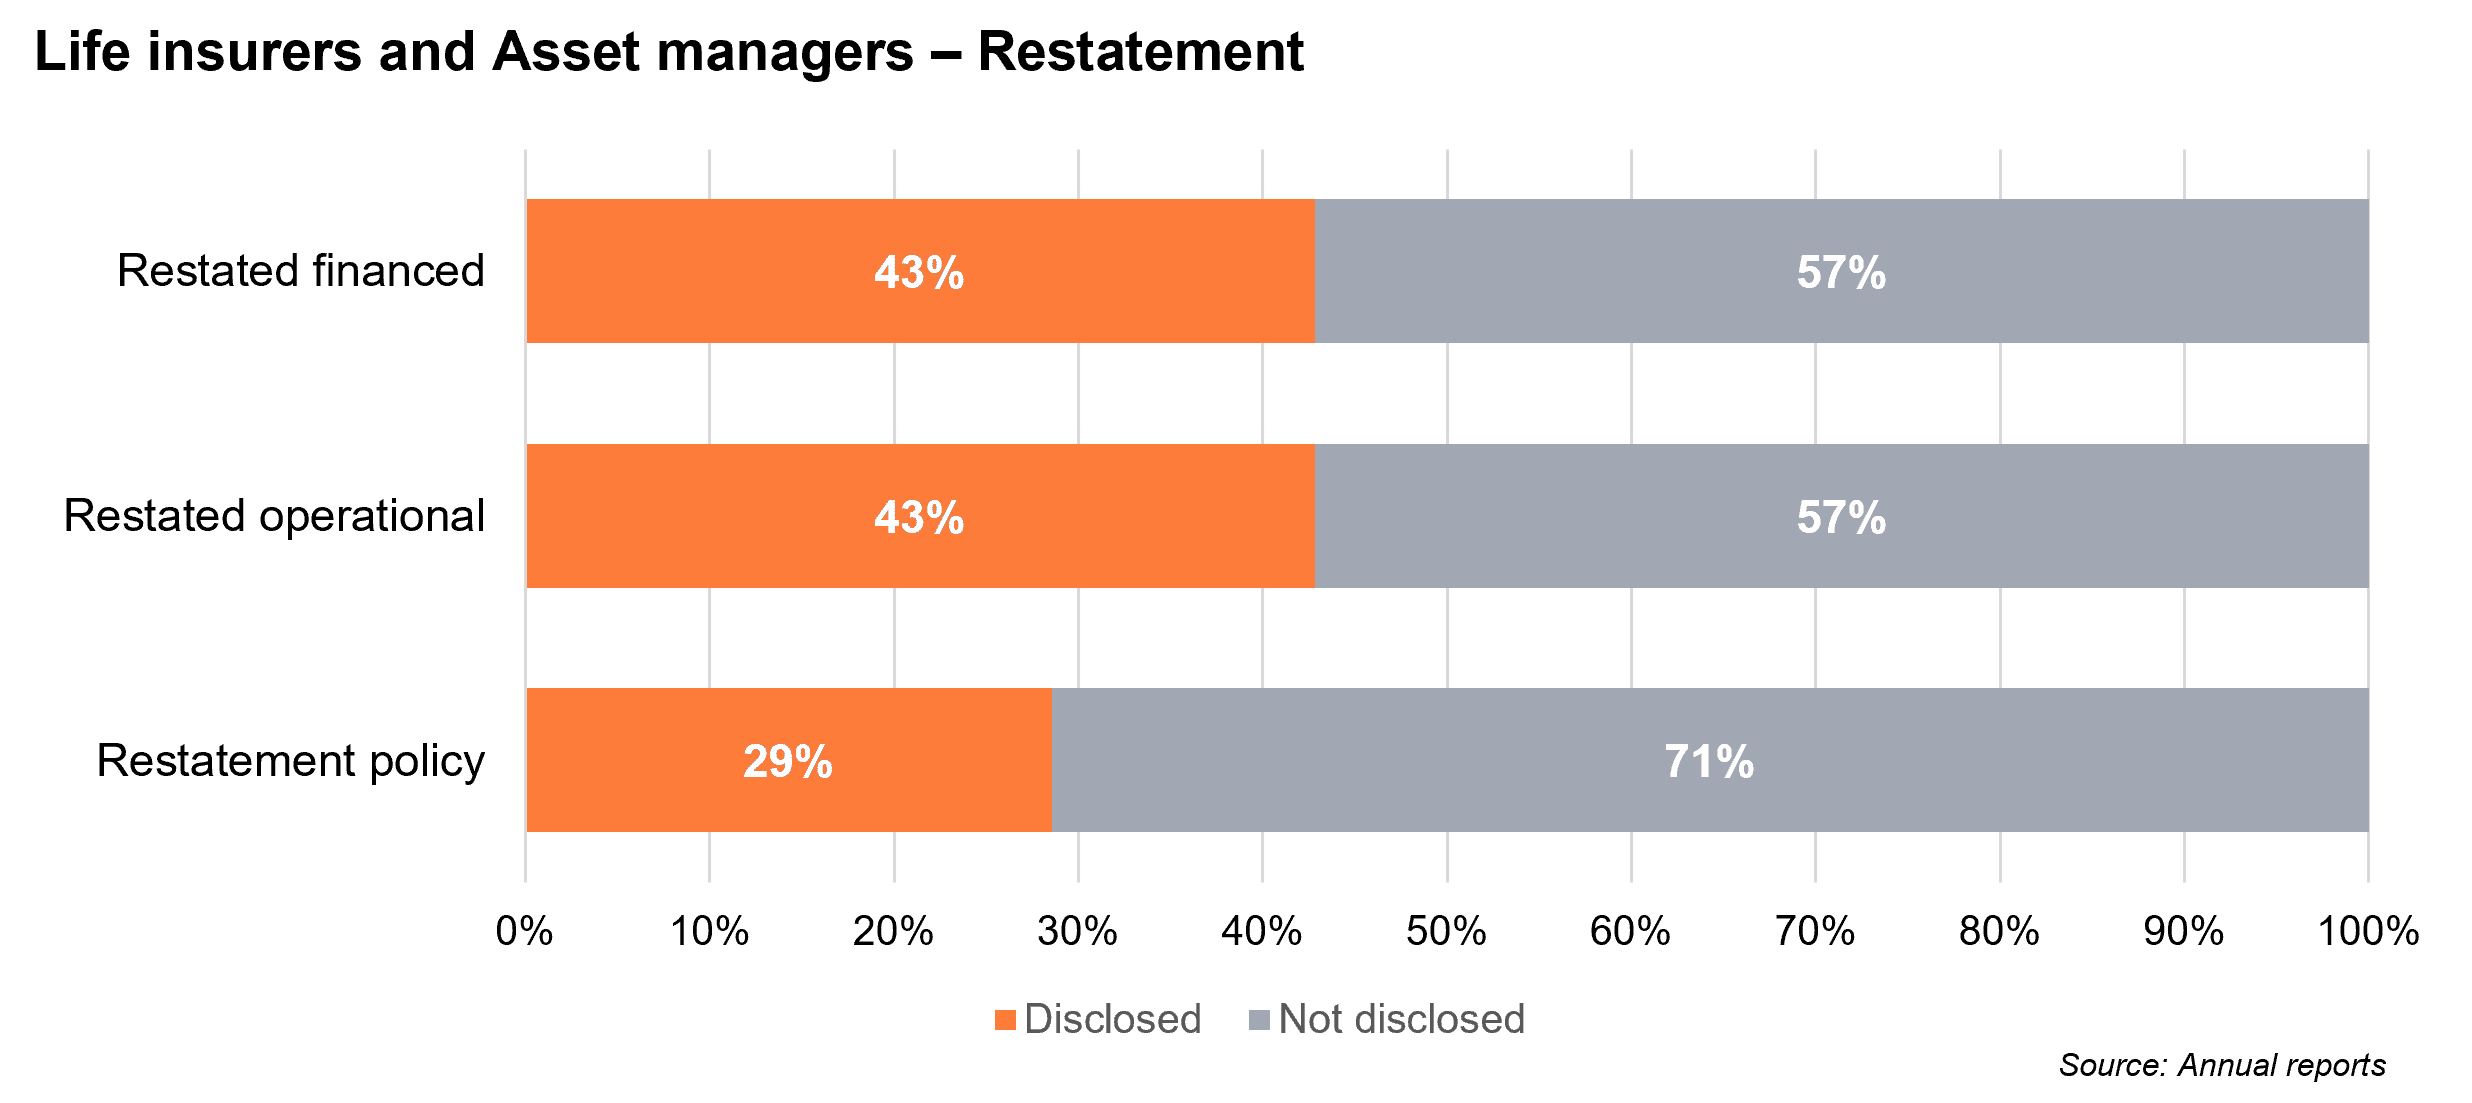
Need for restatement
- On a combined basis 60% of the FIs within our sample have restated either a financed or operational emissions metric within their 2024 disclosures (see more detail in graphs below).
- While only 26% of these have disclosed the existence of a restatement policy. Most have provided narratives explaining the reason for restatement, with the primary reason being changes in methodology or improvements in data quality.
- Overall 40% of FIs within our sample have restated a financed emissions metric while 47% have restated an operational emissions metric please see more detail in graphs below.
Sustainable finance
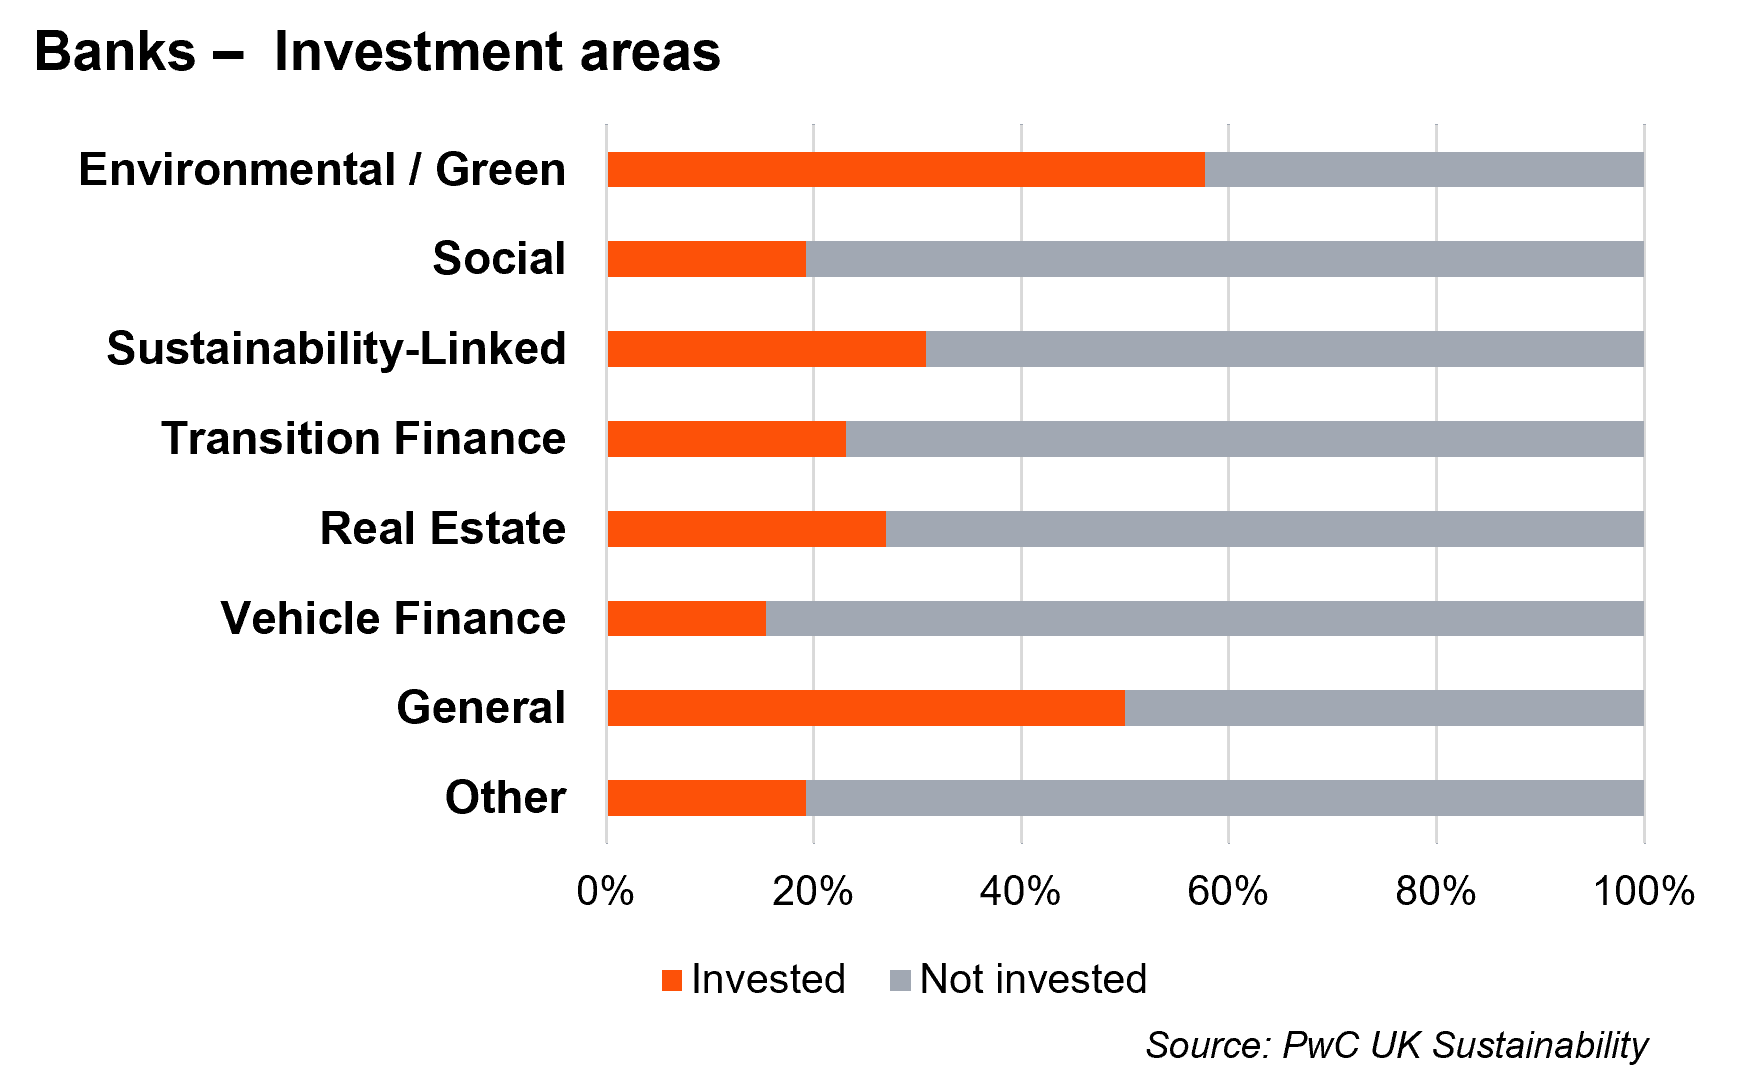
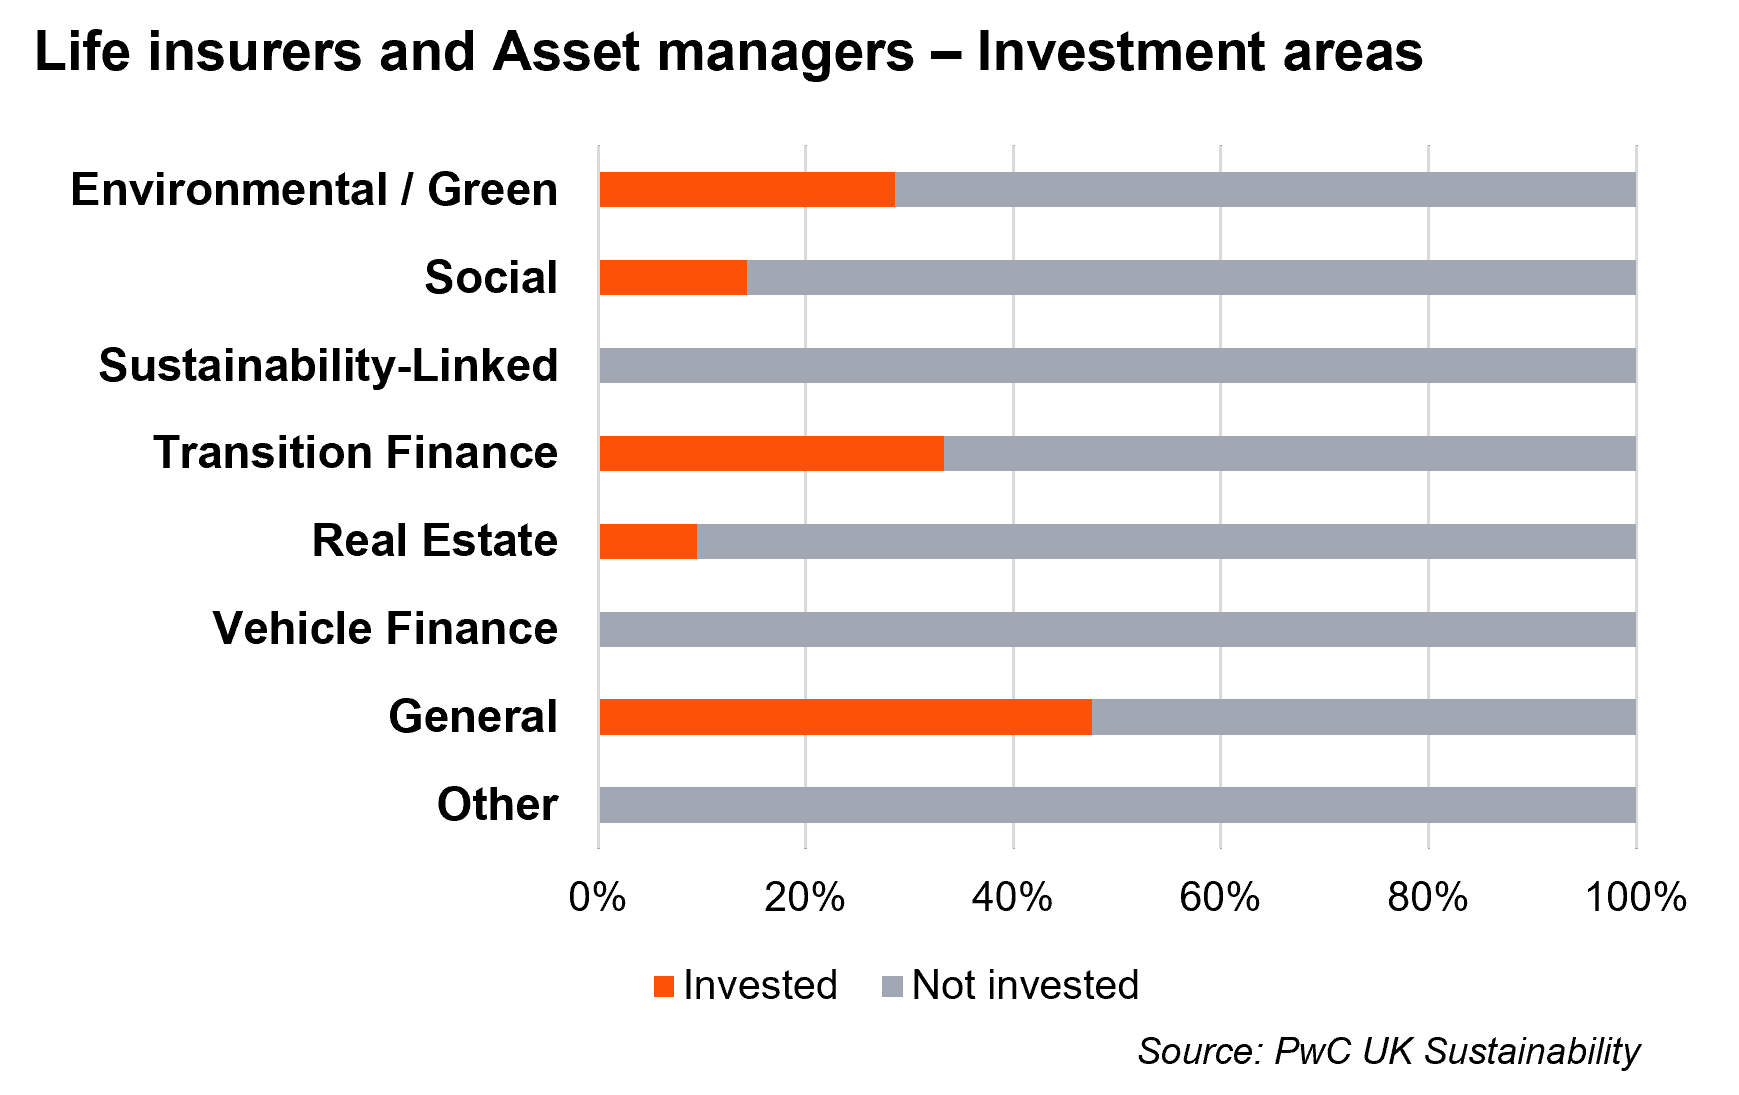
- We have observed that overall across all classifications 88% of Banks and 71% of Life Insurers & Asset Managers, within our sample, have disclosed a sustainable finance investment amounts or targets in their 2024 reports.
- Within this disclosing population, the investment areas being disclosed greatly vary from institution to institution. 58% of Banks in our sample disclosed investments in Environmental / Green areas however the rest of the areas are much less consistent. No single area was commonly disclosed by Life Insurers & Asset Managers, with the most common areas being Transition Finance.
- We note there is a lack of consistency in the basis of reporting of sustainable finance and hence the categorisation varies considerably, from specific products to a general ESG umbrella for example. Hence the inclusion of the ‘General’ area above.
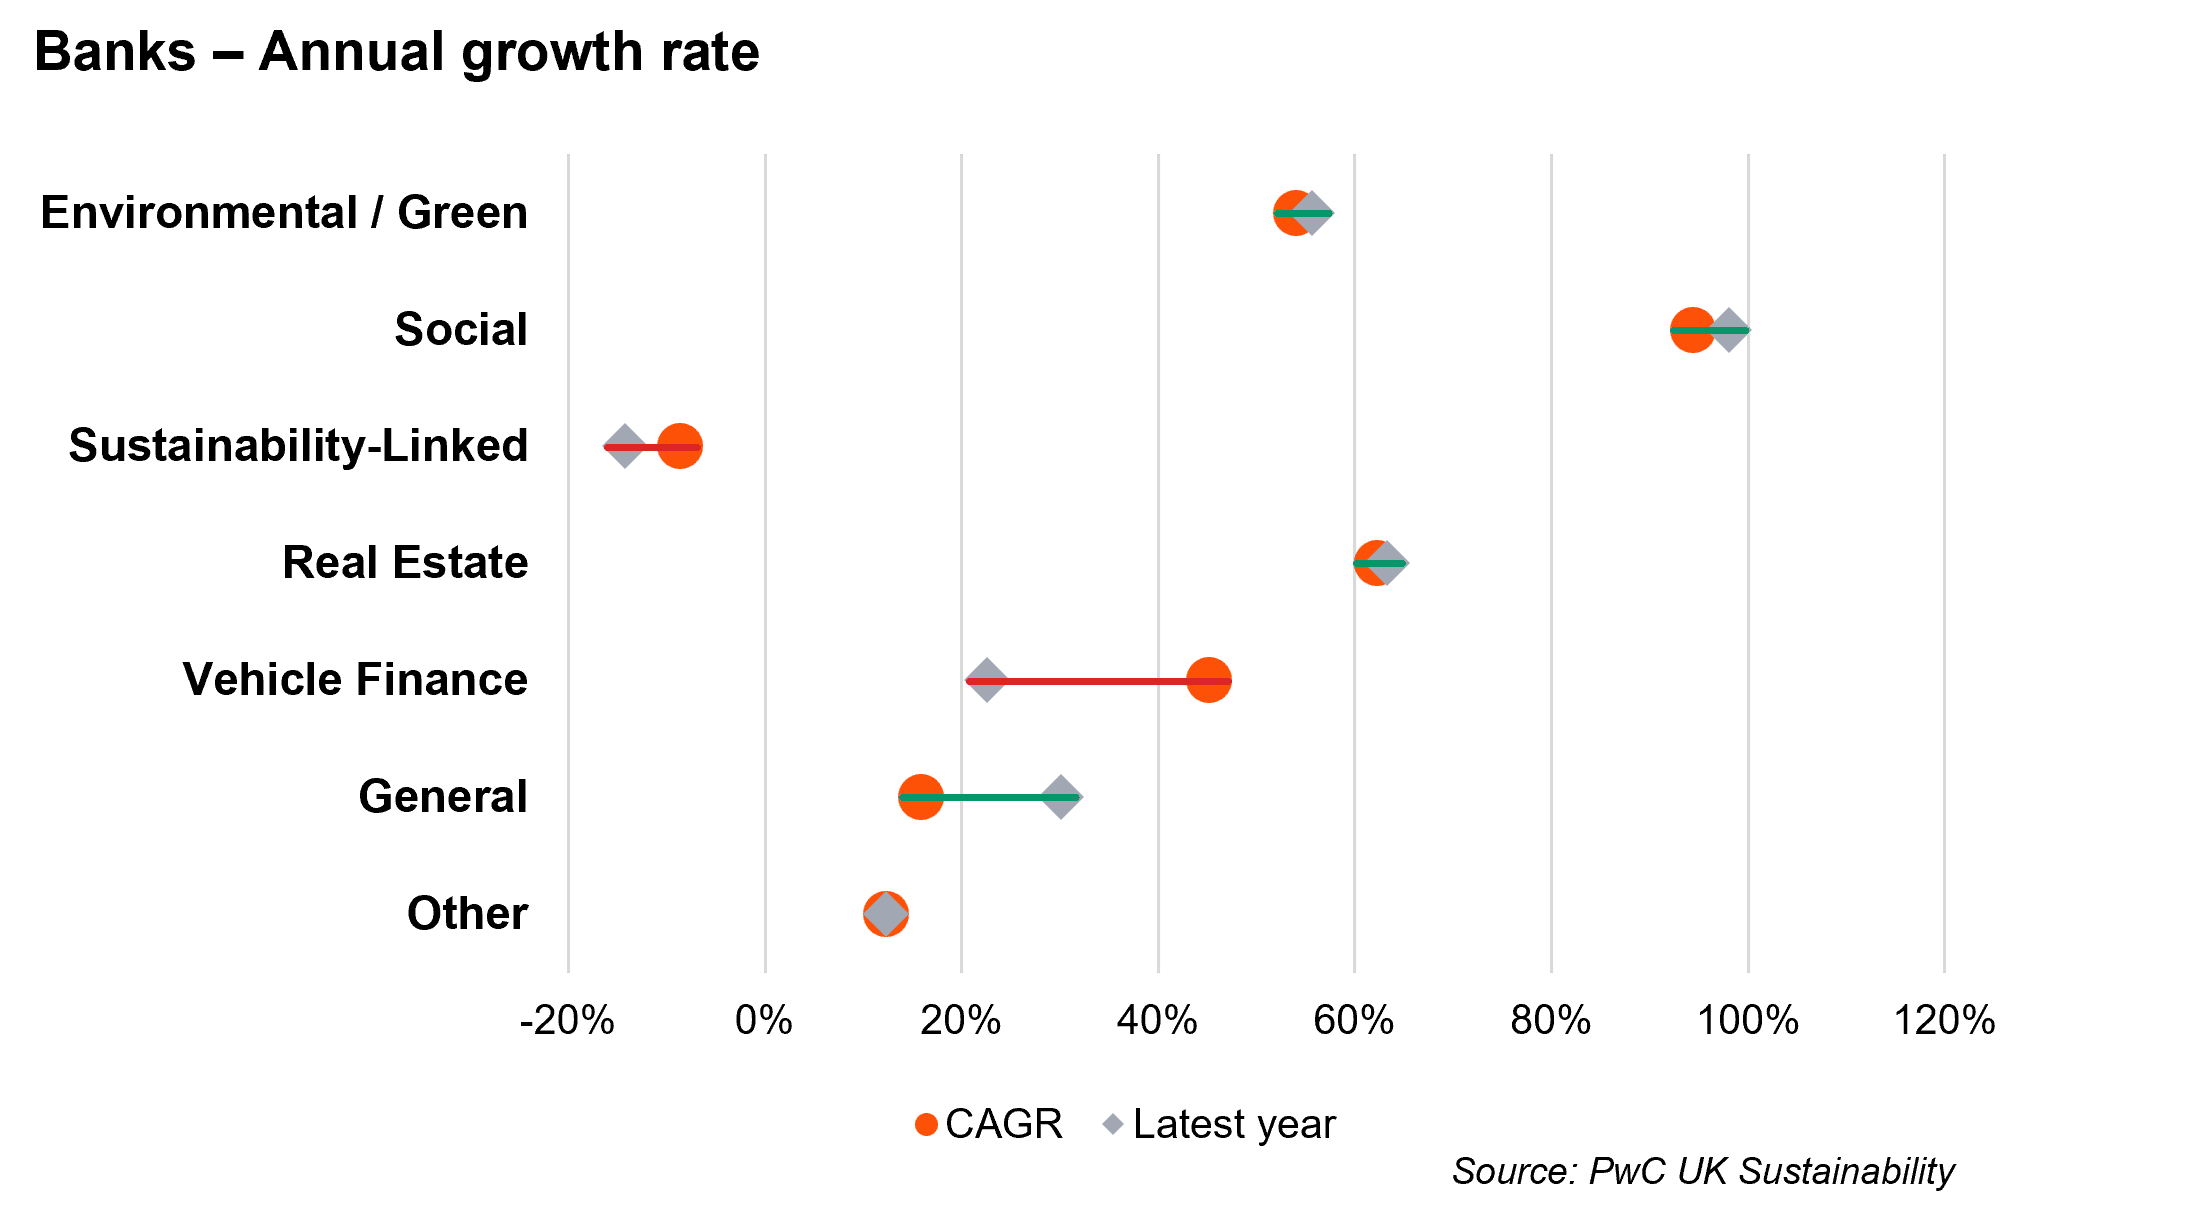
- Every category, other than Sustainability-Linked and Vehicle Finance has shown significant positive growth over recent history with 4 out of 7 still gaining more momentum.
- Environmental / Green, Social and Real Estate financing continue to show sustained growth and even slight increasing momentum. Indicating institutional prioritisation and strong market demand.
- Vehicle Finance is shown to be experiencing significant deceleration. Despite strong historical growth, recent momentum has dropped. This is potentially due to the maturing of the EV market alongside reduction in government incentives.
Additional considerations & variations
- Metrics disclosed: We continue to note deviations between the metrics disclosed by participants. Some included absolute metrics while others included intensity metrics. This deviation not only occurs between participants, but also across asset classes/sectors within the same participant’s report. The selection of absolute or intensity metrics is potentially influenced by data quality and/or the emissions intensiveness of a sector or asset class; for example, sectors with high emissions or reliable data may warrant absolute disclosures, while those with limited data availability or lower emissions may be better suited to intensity-based metrics to ensure meaningful comparison and tracking over time.
- Level and transparency of disclosures vary between participants. Key observations and variations include:
- Disclosing the % of assets under management (AUM) for Life Insurers & Asset Managers as part of emissions for each asset class and clear narrative on exclusions.
- Disclosure of the size of book analysed and the data coverage of financed emissions calculations has significantly decreased in recent years. However since the 2023 benchmark this trend has stabilised. 51% of all reported emission metrics were accompanied by an exposure. This is a very slight increase on the previous year suggesting that FIs may be starting to prioritise transparency of their figures - PCAF guidance prescribes disclosure of coverage across the seven asset classes.
- PCAF guidance prescribes disclosure of emissions by asset class and this is common, noting where different methodologies have been applied. However prioritisation and/or inclusion of asset classes in disclosure is generally inconsistent.
- The most comprehensive disclosures tend to include a baseline year, 1 or 2 interim years followed by the latest reporting year, to allow ease of compatibility and tracking. Other, more limited, disclosures only feature the latest reporting year. - CSRD requires baseline year disclosure.
- Disclosing scope of emissions numbers such as value chain or counterparty emissions included. - CSRD requires disclosure of the scope of emissions included and clarification of the boundary of emissions data.
2. Scope & assumptions: Defining the boundaries
While there is established guidance for measuring financed emissions, it is not fully prescriptive and leaves room for interpretation. As a result, financial institutions (FIs) may apply different approaches, leading to variations in the scope of reported figures. This section outlines these key differences in scoping decisions.
- Asset class and value chain coverage continues to expand year-on-year, driven by smaller and regionally focused FIs often due to improved data access and phased implementation strategies. Whereas, large, globally active FIs are focused on investing in integrated, enterprise-wide reporting structures.
- Banks are prioritising the highest-emitting sectors, with baseline years ranging from 2018/2019 to 2024, reflecting differing maturity levels across portfolios.
- Coverage has increased across almost every asset class, specifically for Banks. This trends reflect a sector steadily broadening its emissions scope while refining disclosure depth in response to rising expectations..
Asset classes & sectors
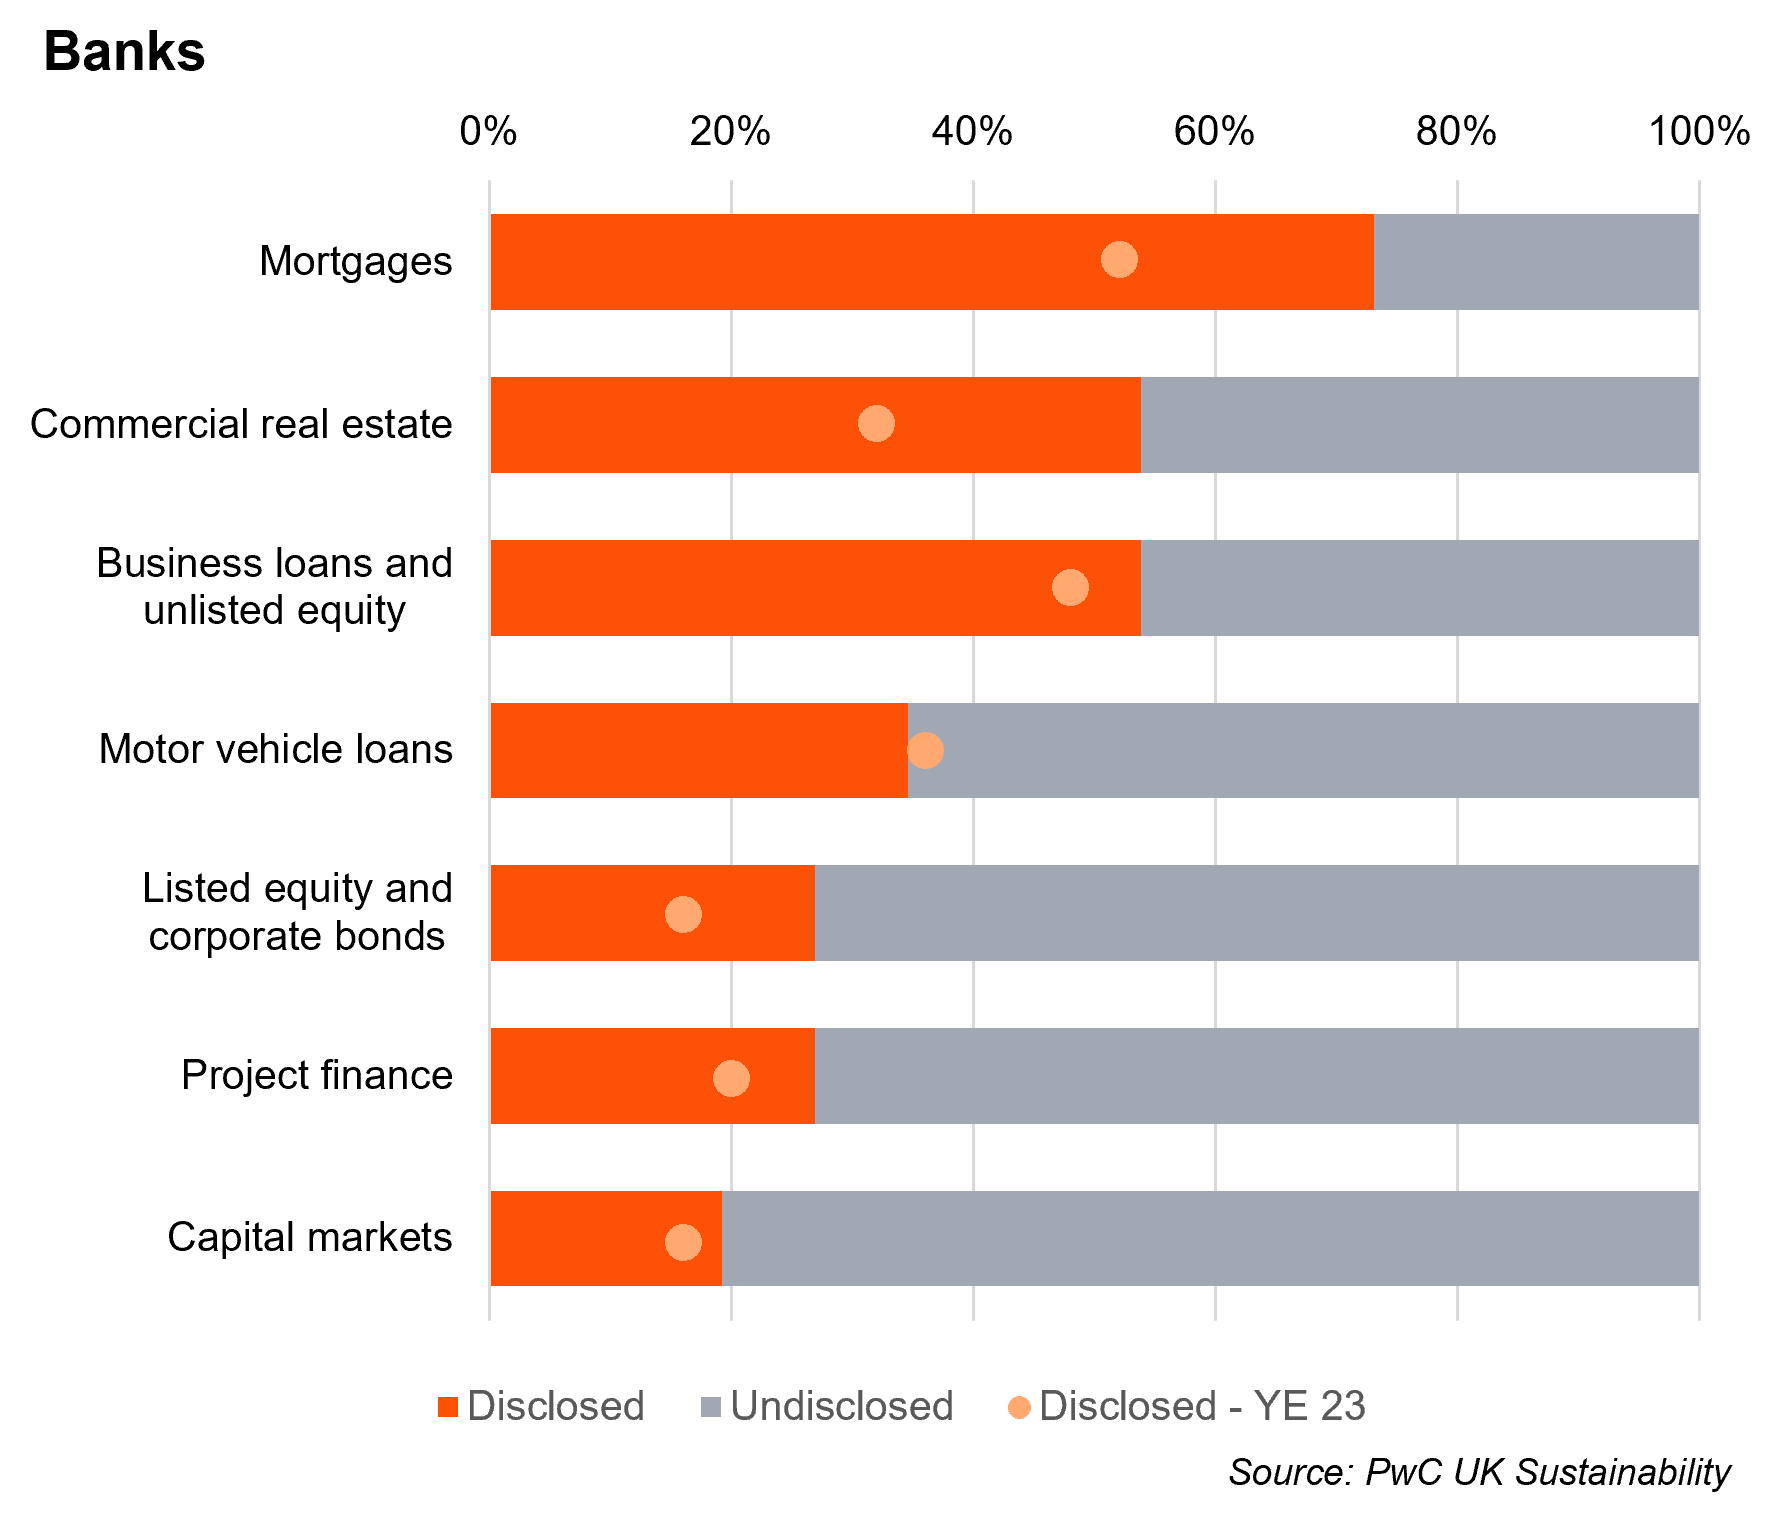
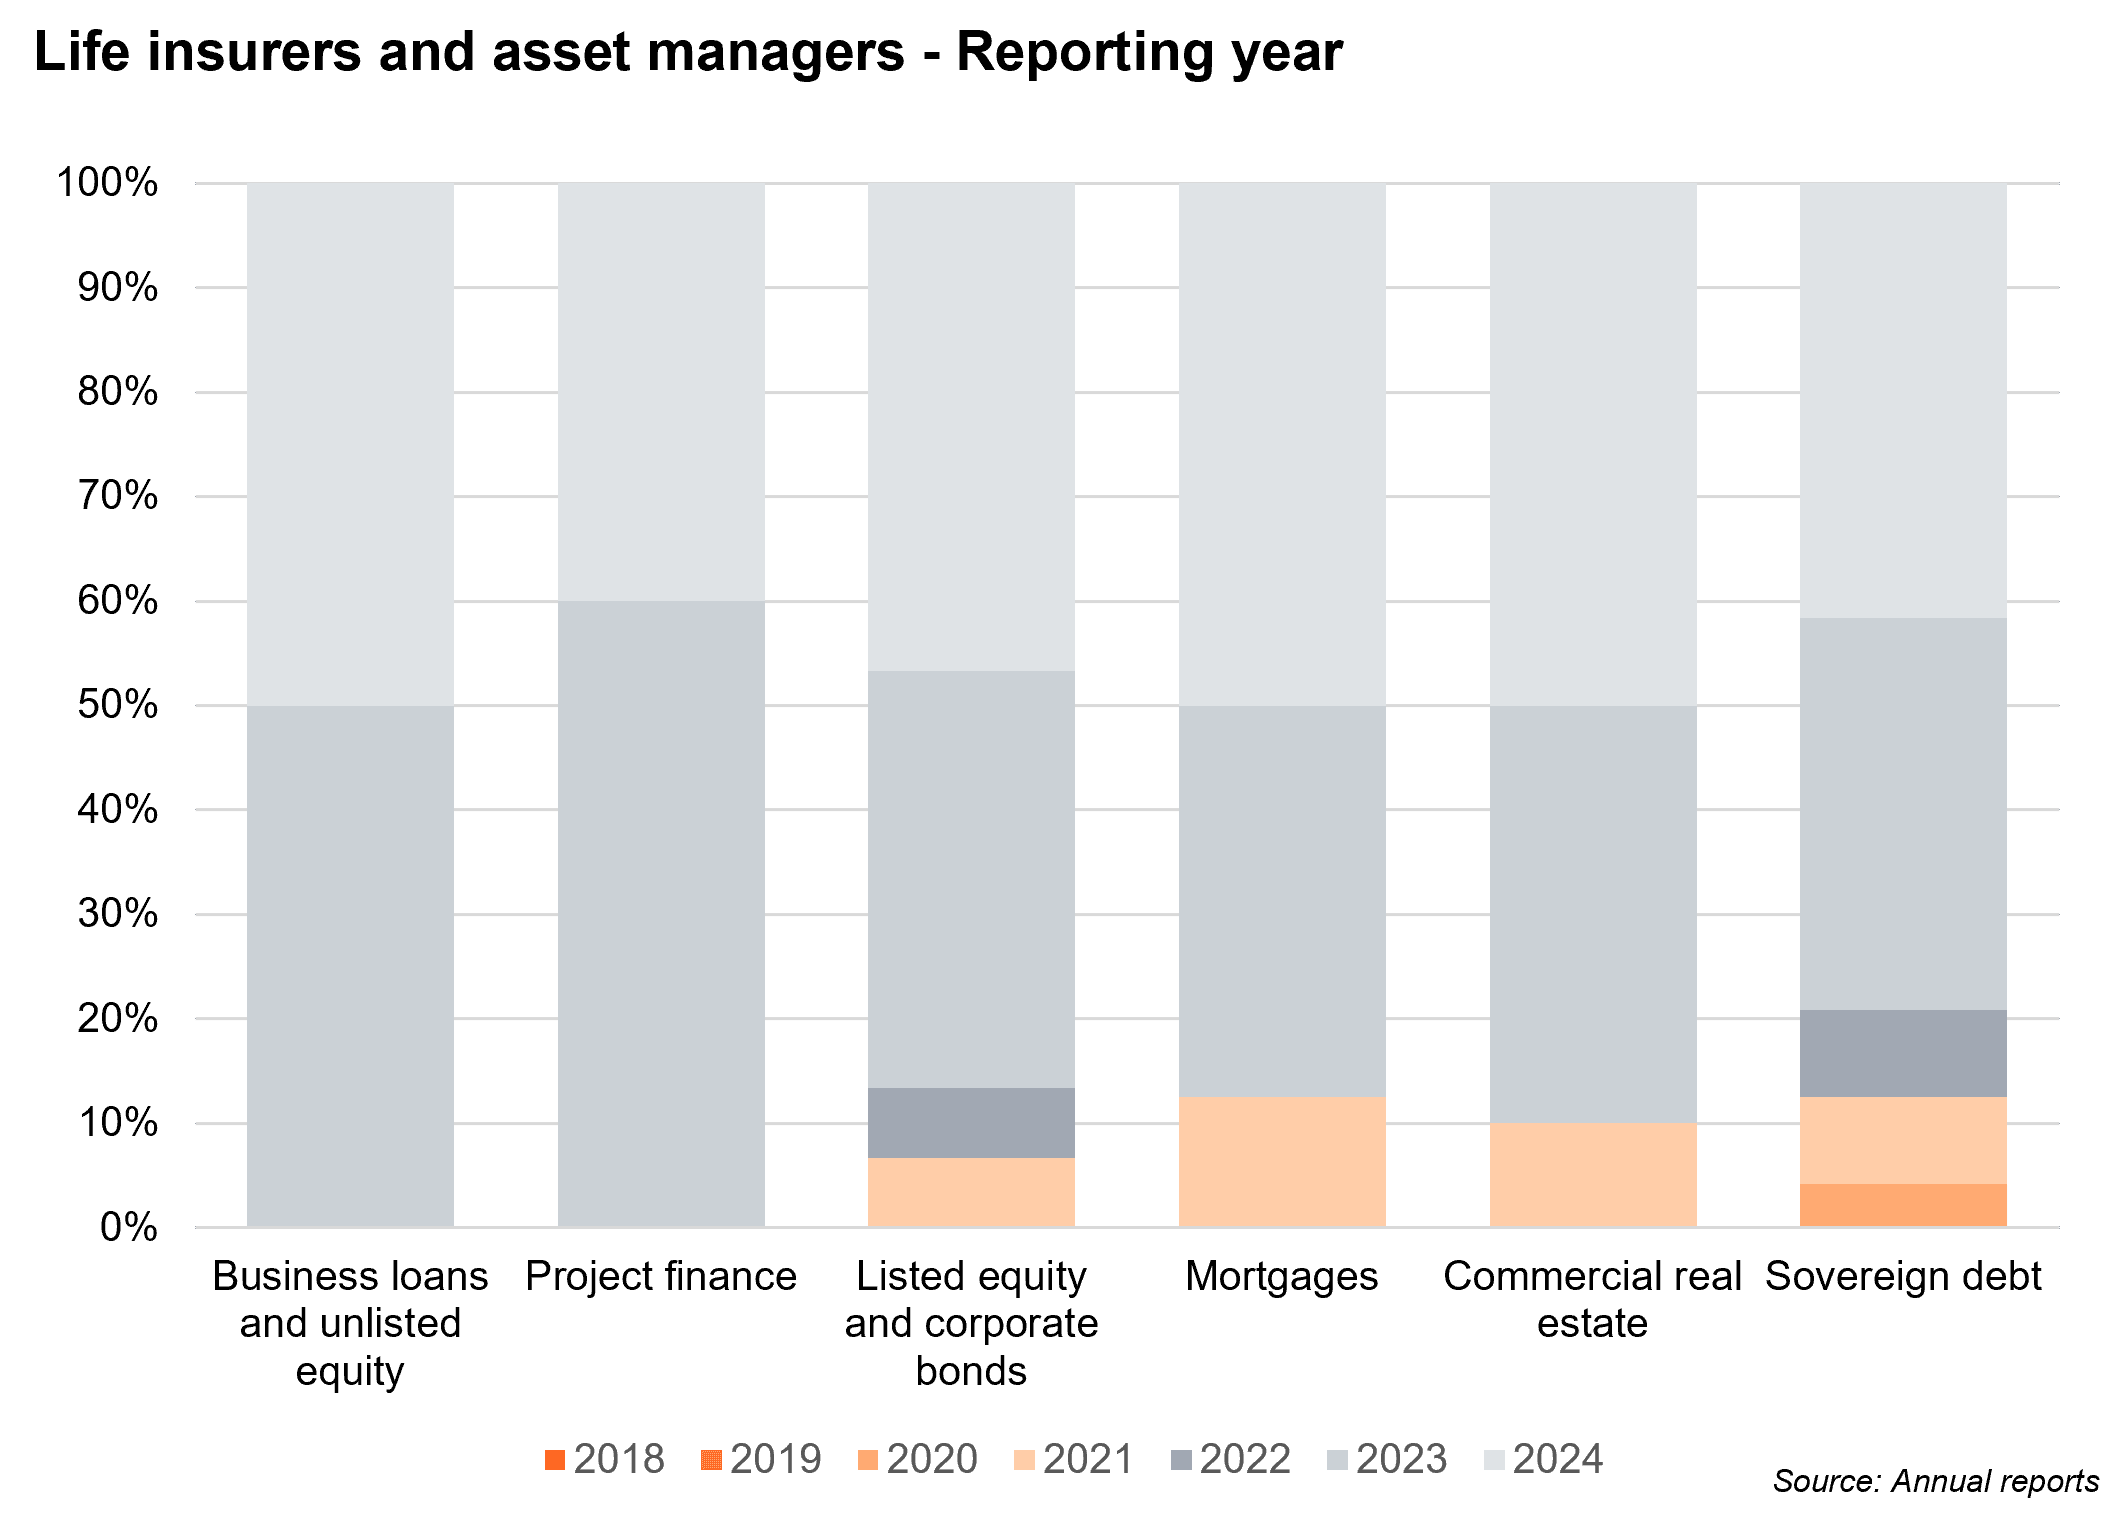
- Generally, across the Banks sample, we have observed an increase in the coverage across asset classes.
- Remaining consistent with the prior year disclosures, business loans and mortgages were the most reported by Banks however, we have seen a rise commercial real estate disclosures.
- While sovereign debt and listed equity remain the most reported by Life Insurers & Asset Managers, we observe a decrease in commercial real estate disclosures. This is driven by a change in the composition of our sample of Life insurer and Asset Managers.
- From the disclosures we also noted the following:
- FIs are taking a phased approach to disclosing financed emissions, focusing on the most material sectors / asset classes first.
- Life Insurers & Asset Managers’ disclosures continue to be at asset class level while most Banks disclosed at sector level covering different asset classes where relevant (e.g. loans, project finance).
PCAF asset class distribution
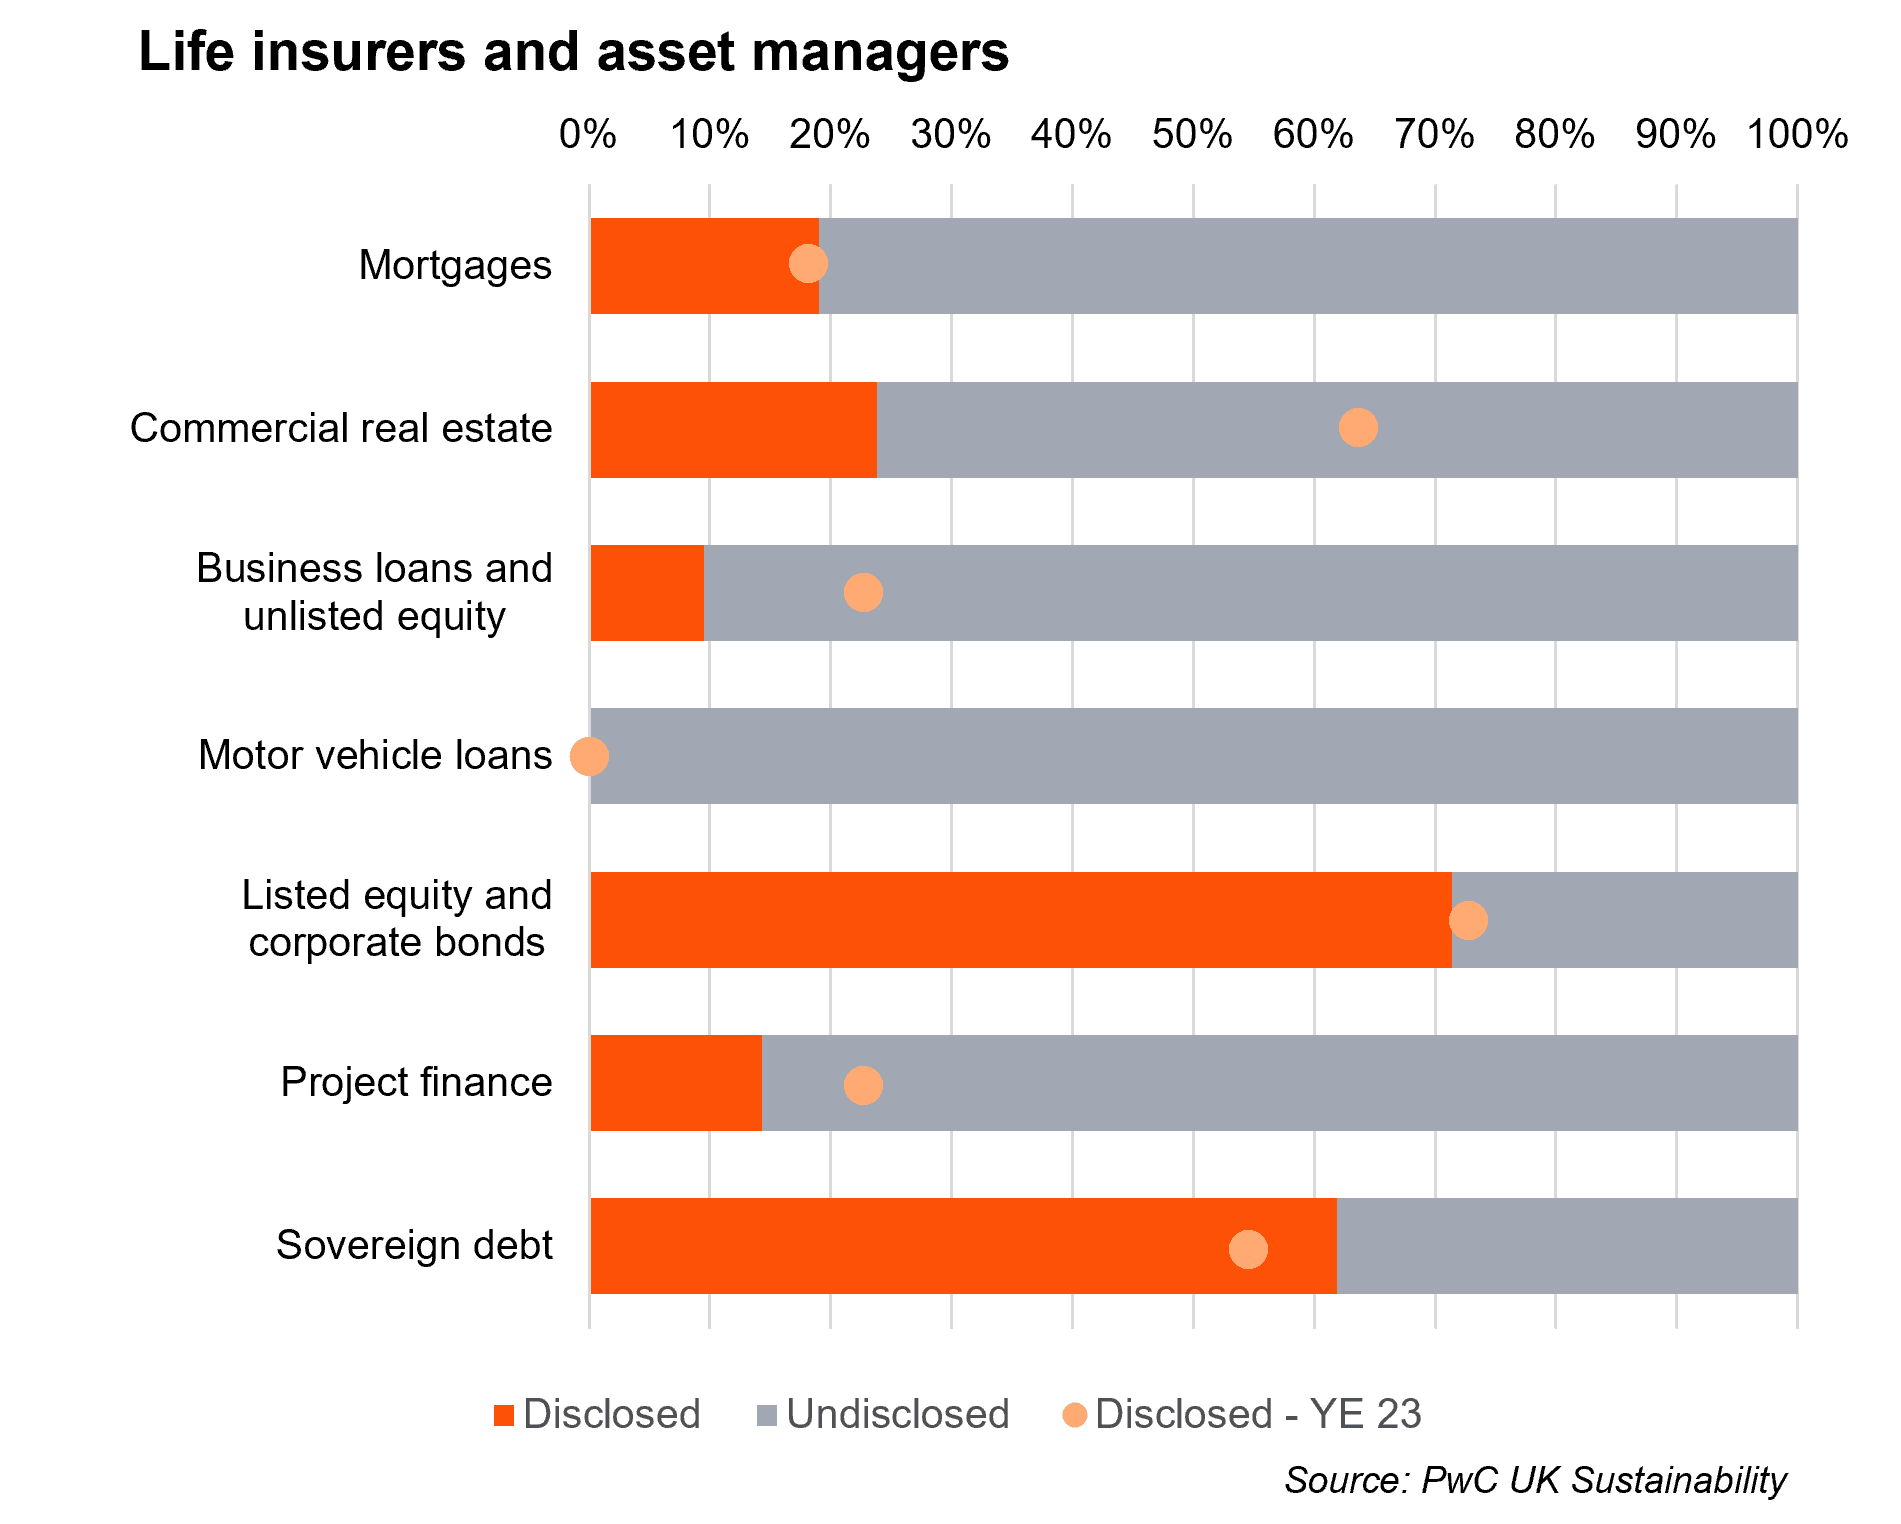
Please note, certain asset classes are more relevant to a lending book activities (i.e Banks) compared to investments activities (i.e Life Insurers & Asset Managers) and vice versa. Therefore, motor vehicle loans and capital markets asset classes are not reported on by Life Insurers & Asset Managers.
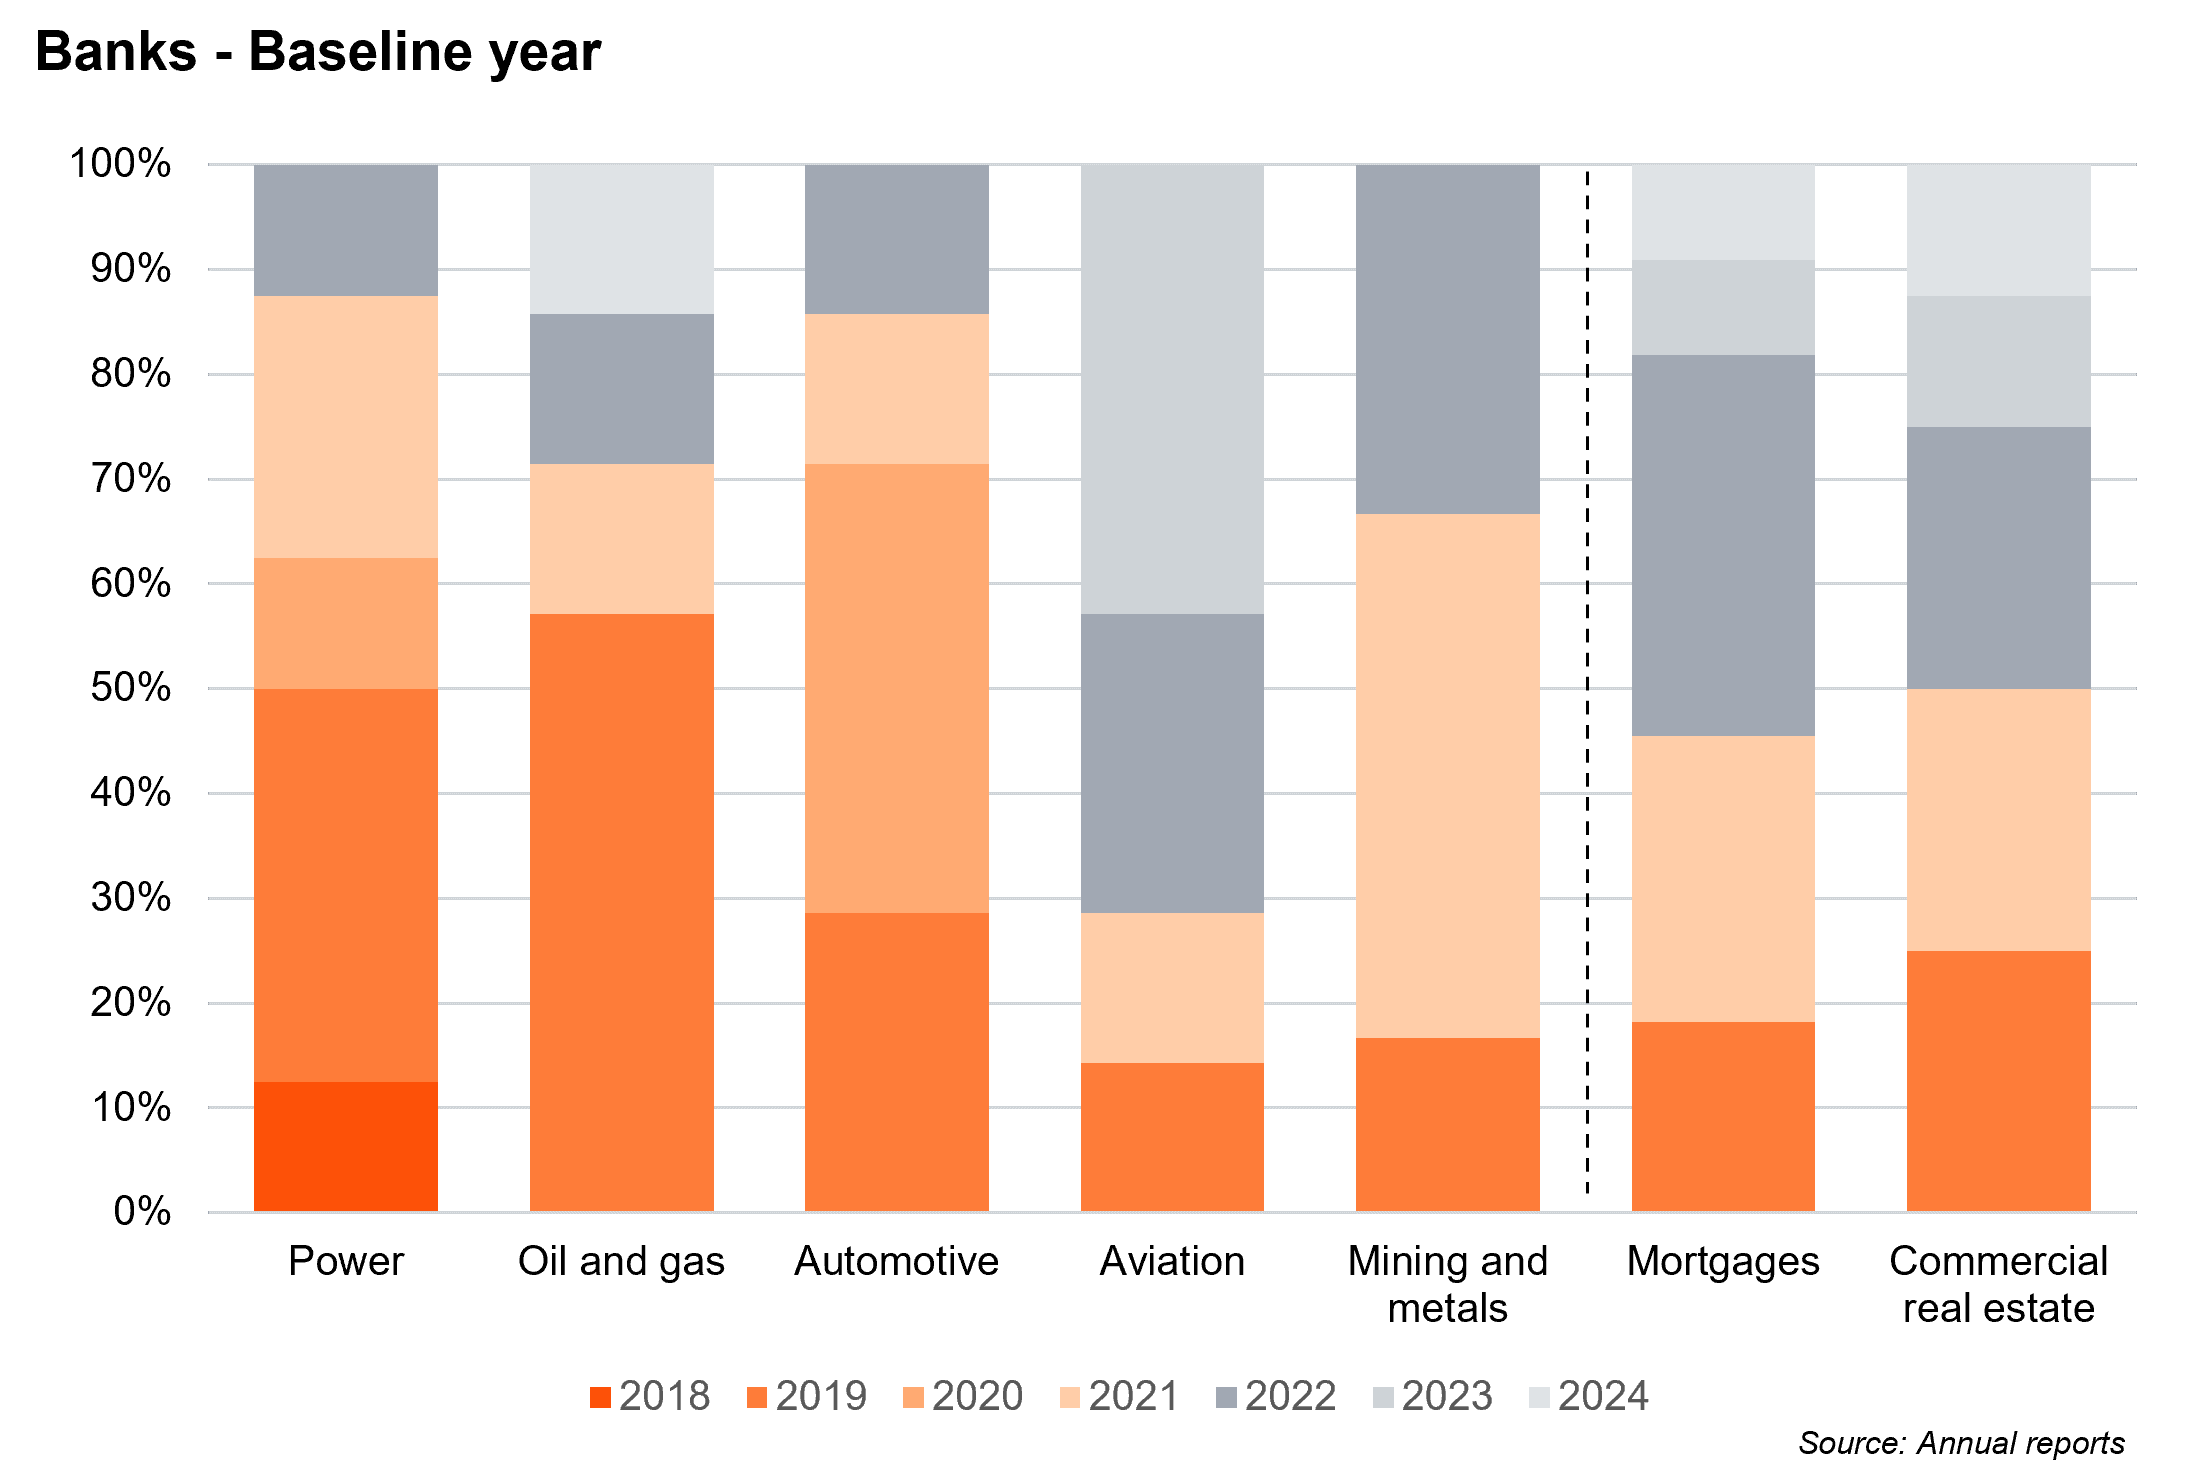
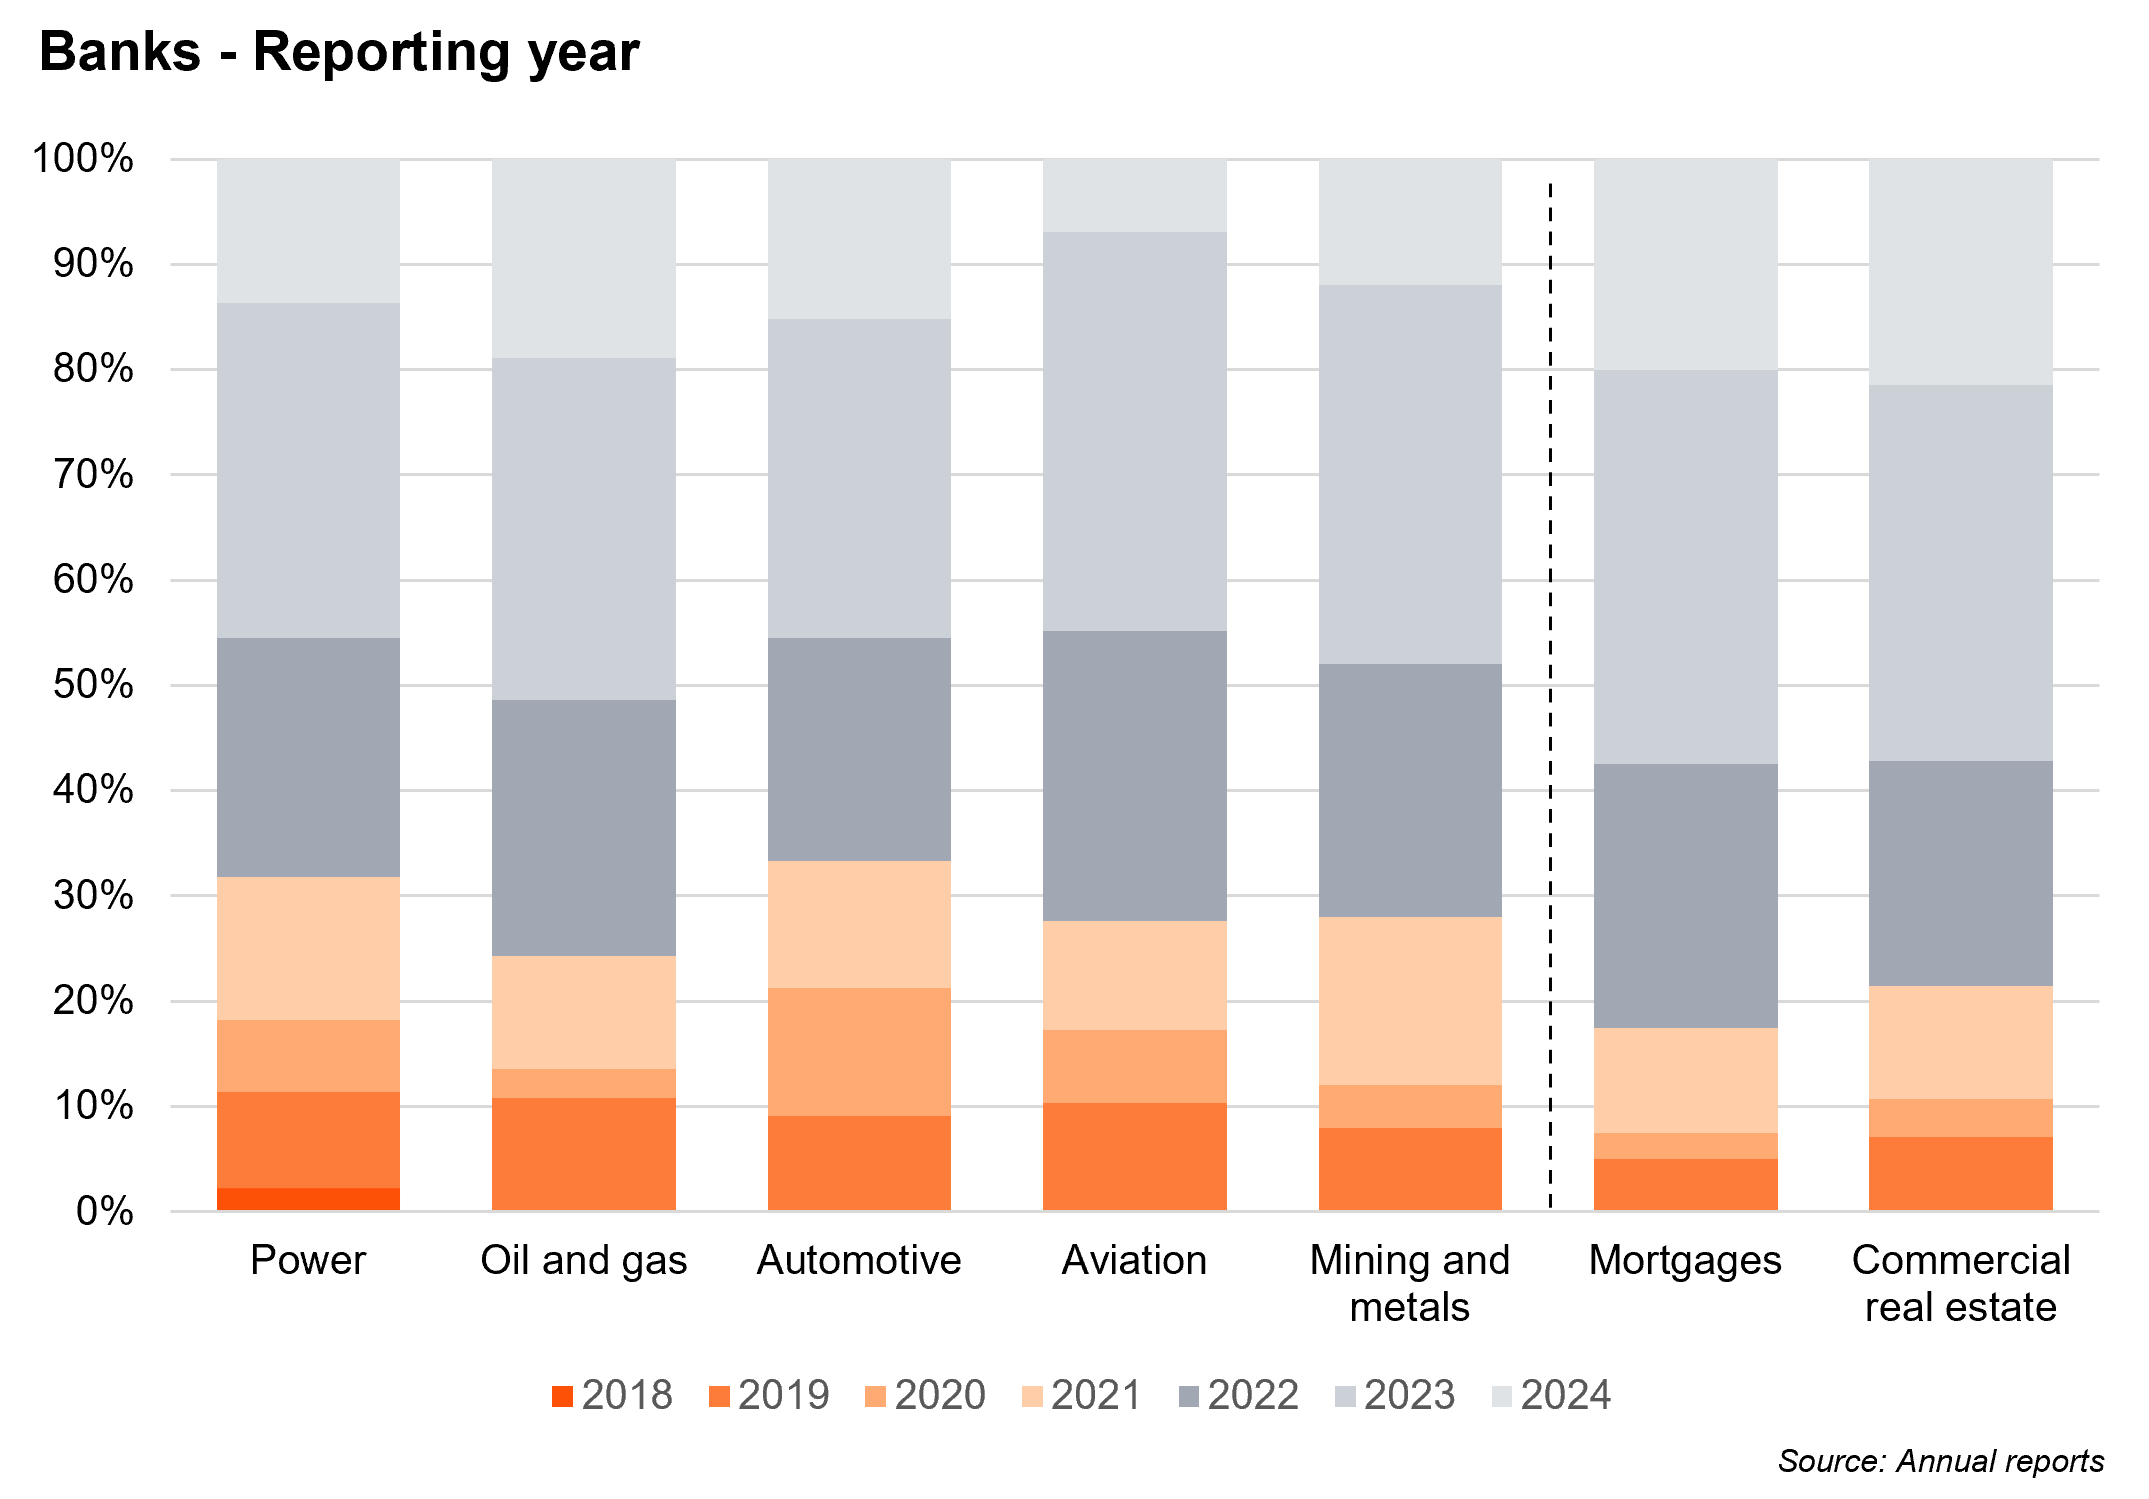
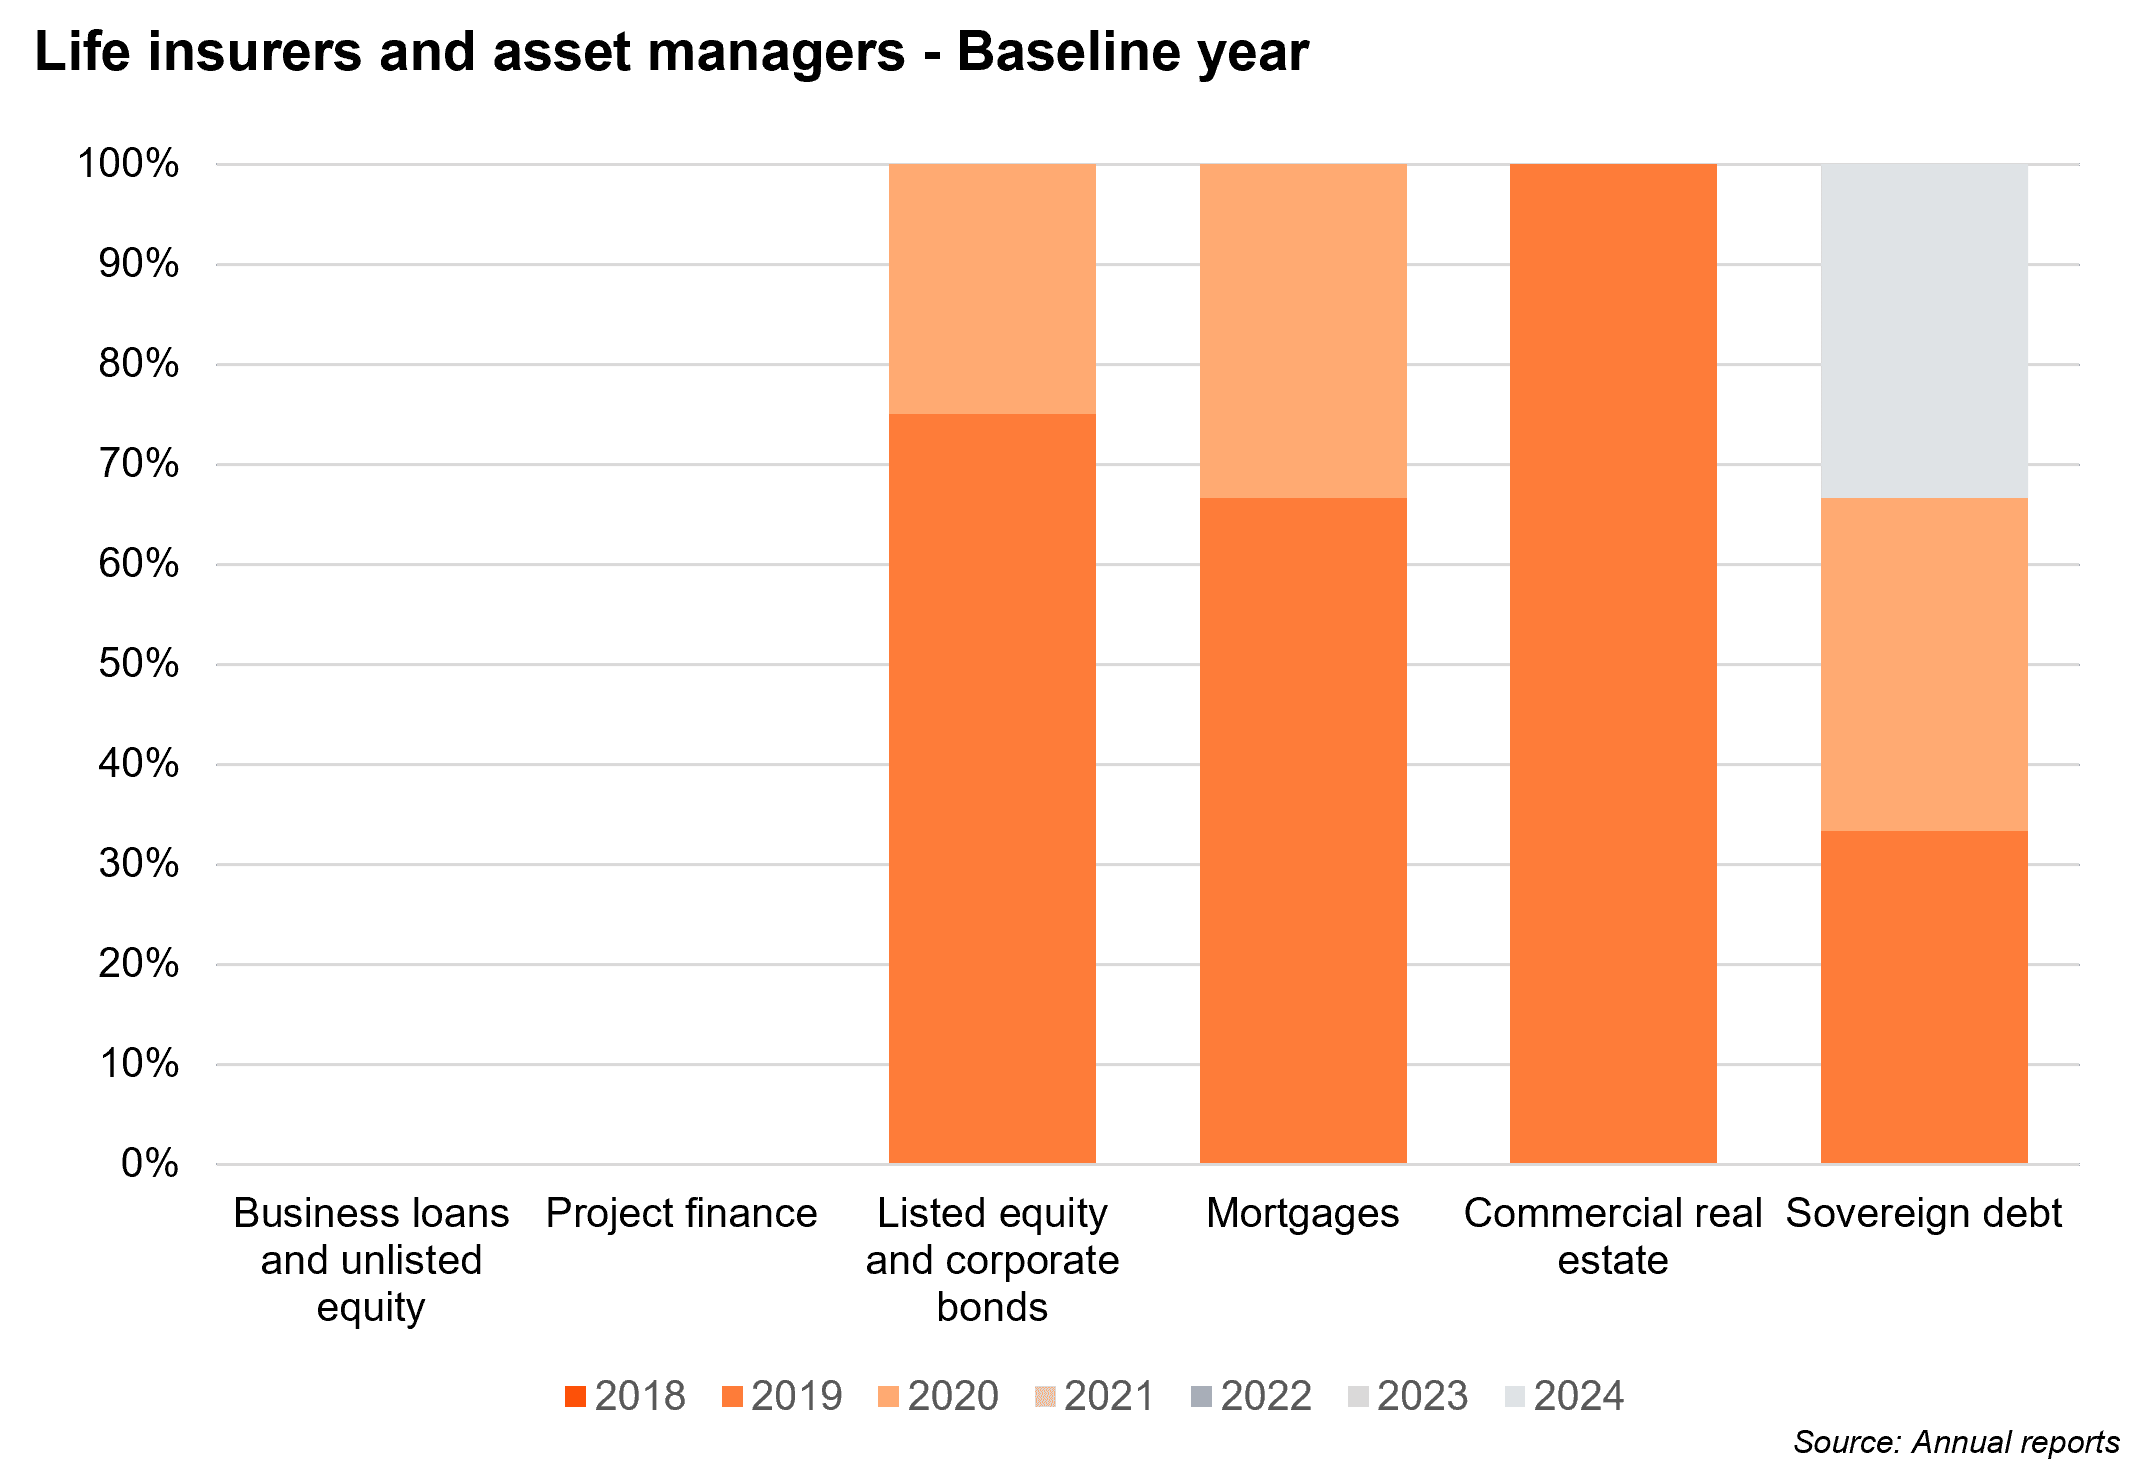
Baseline and reporting years
Overall
- Participants reported varying baseline years across asset class or sector, representing variations in the data available and phased-in approach taken by institutions whereby new sectors are added in scope of emissions over time. However, Tier 1 / leading FIs are consolidating their reporting, focusing on enhancing data quality and integrating disclosures more strategically, while challenger Banks / small FIs are accelerating efforts to build capability and close the gap in coverage.
- We note that the FIs in our sample often are reporting multiple years following the baseline in each report, for ease of year on year comparison. There is more variation in the amount of years reported within the Banks sample, and Banks tend to include more historical data.
- Baseline years are not always included in disclosures; when they are, they do not always include the accompanying metrics - only the year is mentioned.
Life Insurers & Asset Managers
- The majority of participants have selected a 2019 baseline year and have noted the impact of Covid-19 on their 2020 emissions numbers.
- A number of participants have disclosed emissions without setting a baseline year, reflecting the lack of target setting seen by asset managers. This is observed as 15 FIs disclosing listed equity during 2024, whereas only 4 baseline years have been set.
Banks
- Review of the underlying data shows that for some Banks, the chosen baseline year is not consistent between sectors due to the phased approach.
- Across the majority of sectors, the earliest baseline years are 2018/2019. Noting that the proportion of Banks with these earlier baseline years tends to reflect a phased in approach. For typically less material sectors (such as mortgages, CRE , aviation), we see a far higher proportion of baseline years from 2022 onwards.
Greenhouse Gases (GHGs)
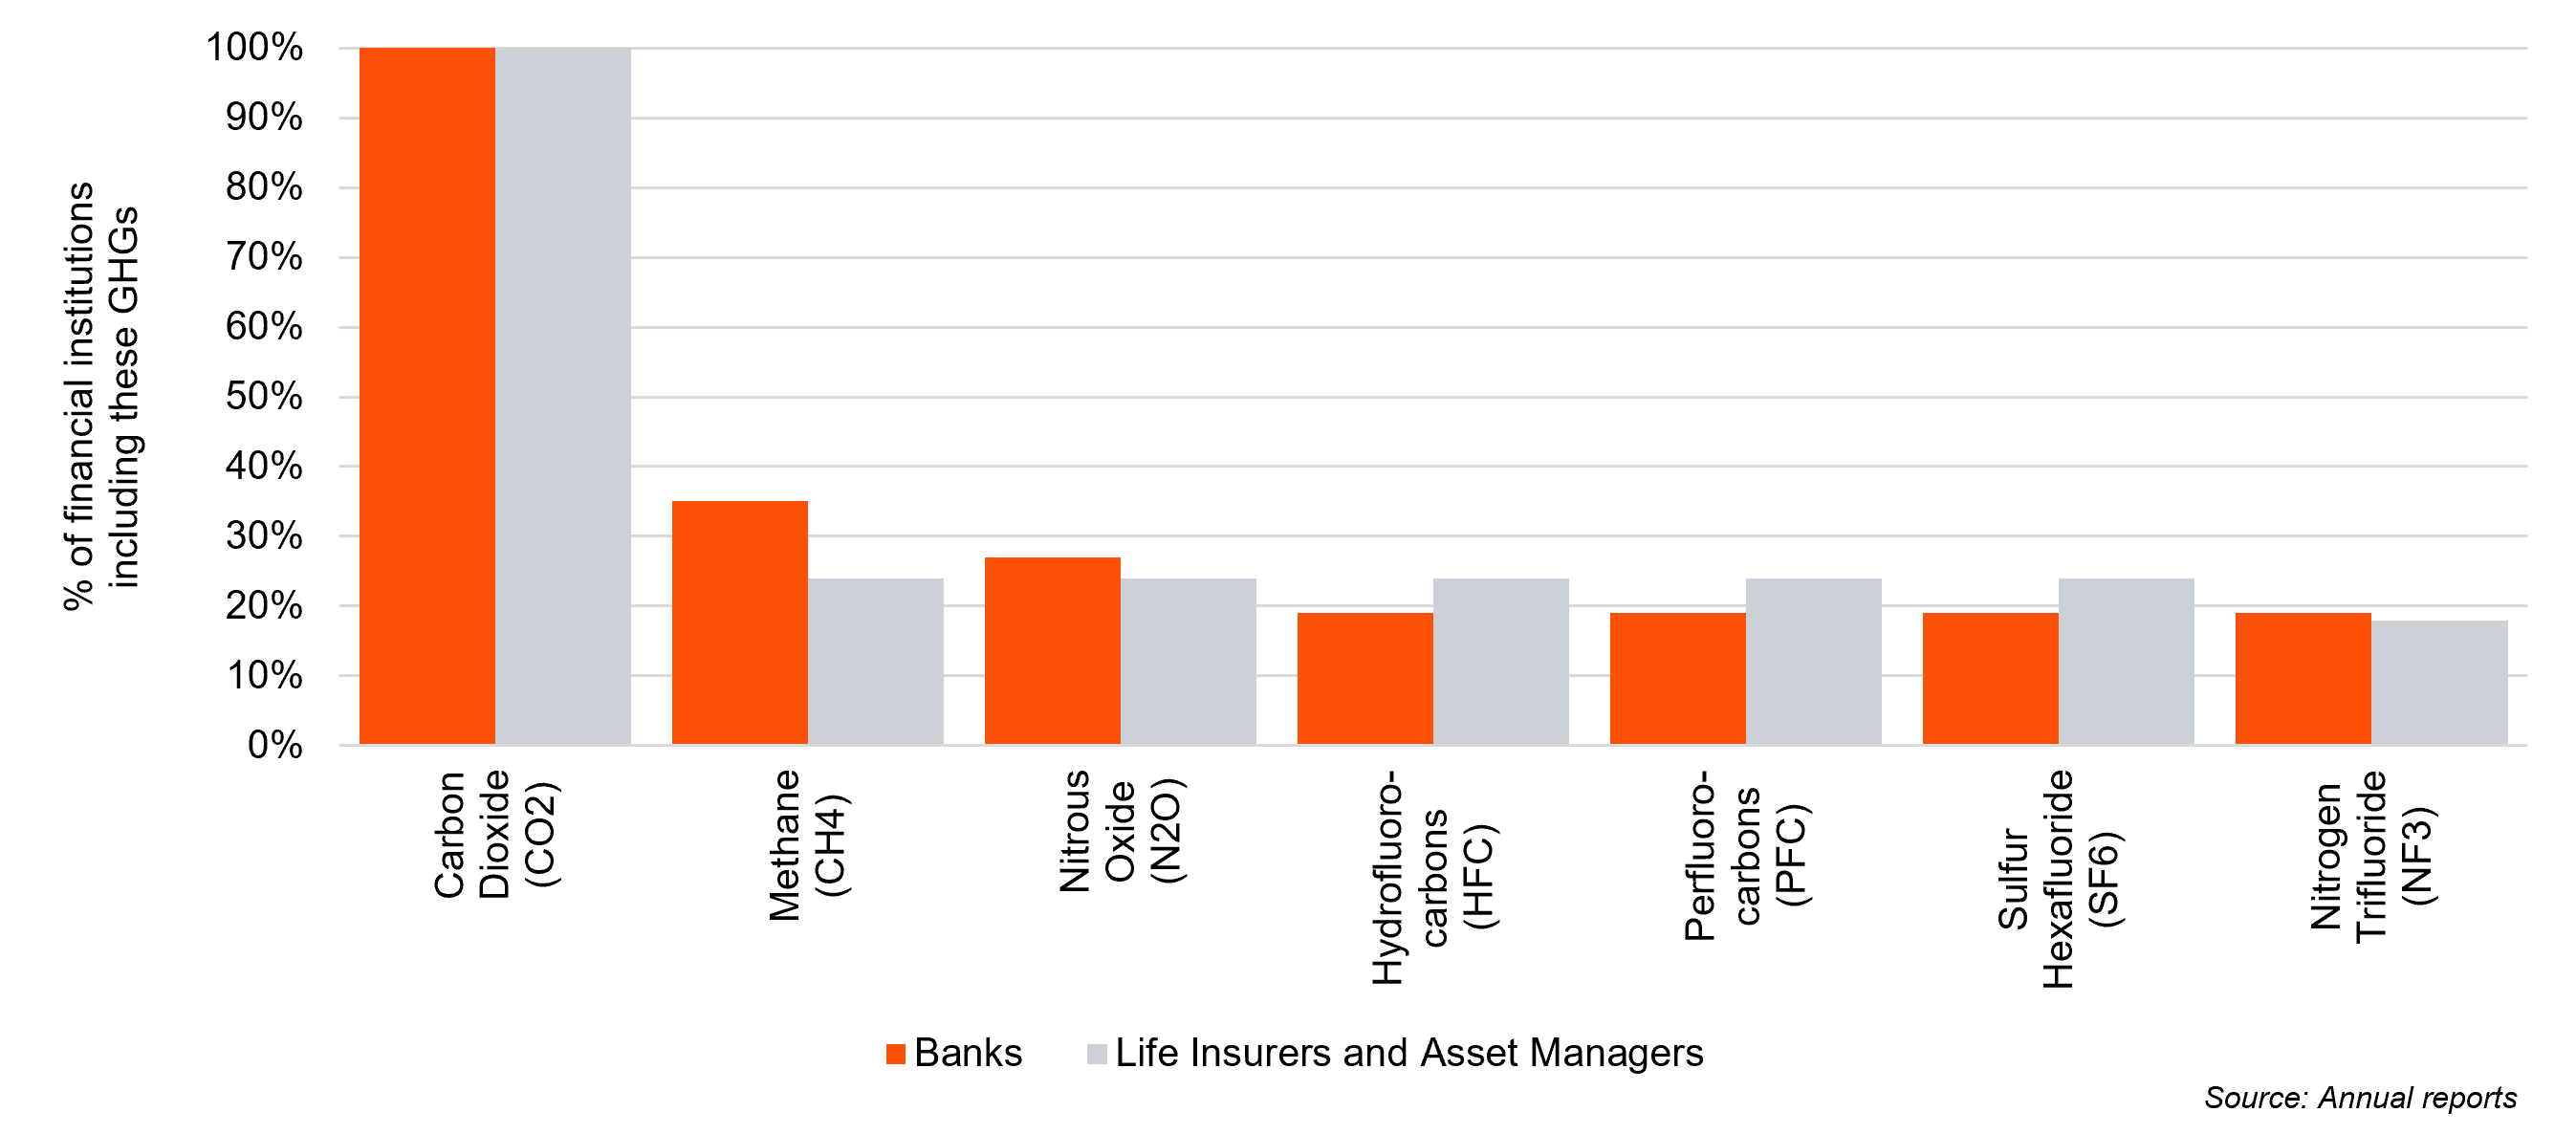
- All participants which report absolute emissions disclose that they at least capture in CO2 within their reported metric in line with last year’s disclosures.
- As shown in the bottom chart, aside from CO2 and CH4 being the most commonly disclosed GHGs, disclosure frequency of other GHGs does not show any significant trend, with each gases being disclosed across 18-27% of the sample.
- Across both the Banks and Life Insurers & Asset Managers samples, the vast majority of institutions are not disclosing the GHGs included in their metrics. Interestingly, when this disclosure is made, it is more often a full disclosure specifying all the gases included, as opposed to mention of the most significant ones.
- When data coverage across asset classes increases, we may observe a increased focus on data transparency and documentation. If this stage is reached, we would expect the number of full GHG disclosures to increase.
GHGs in scope
Borrowers & investors scope of emissions
Overall
- All Banks have disclosed emissions at a sector/asset class level, while Life Insurers & Asset Managers have disclosed at an asset class level, with 2 also disclosing at a sector level.
- There is a great deviation among FIs regarding the inclusion of scope 3 emissions.
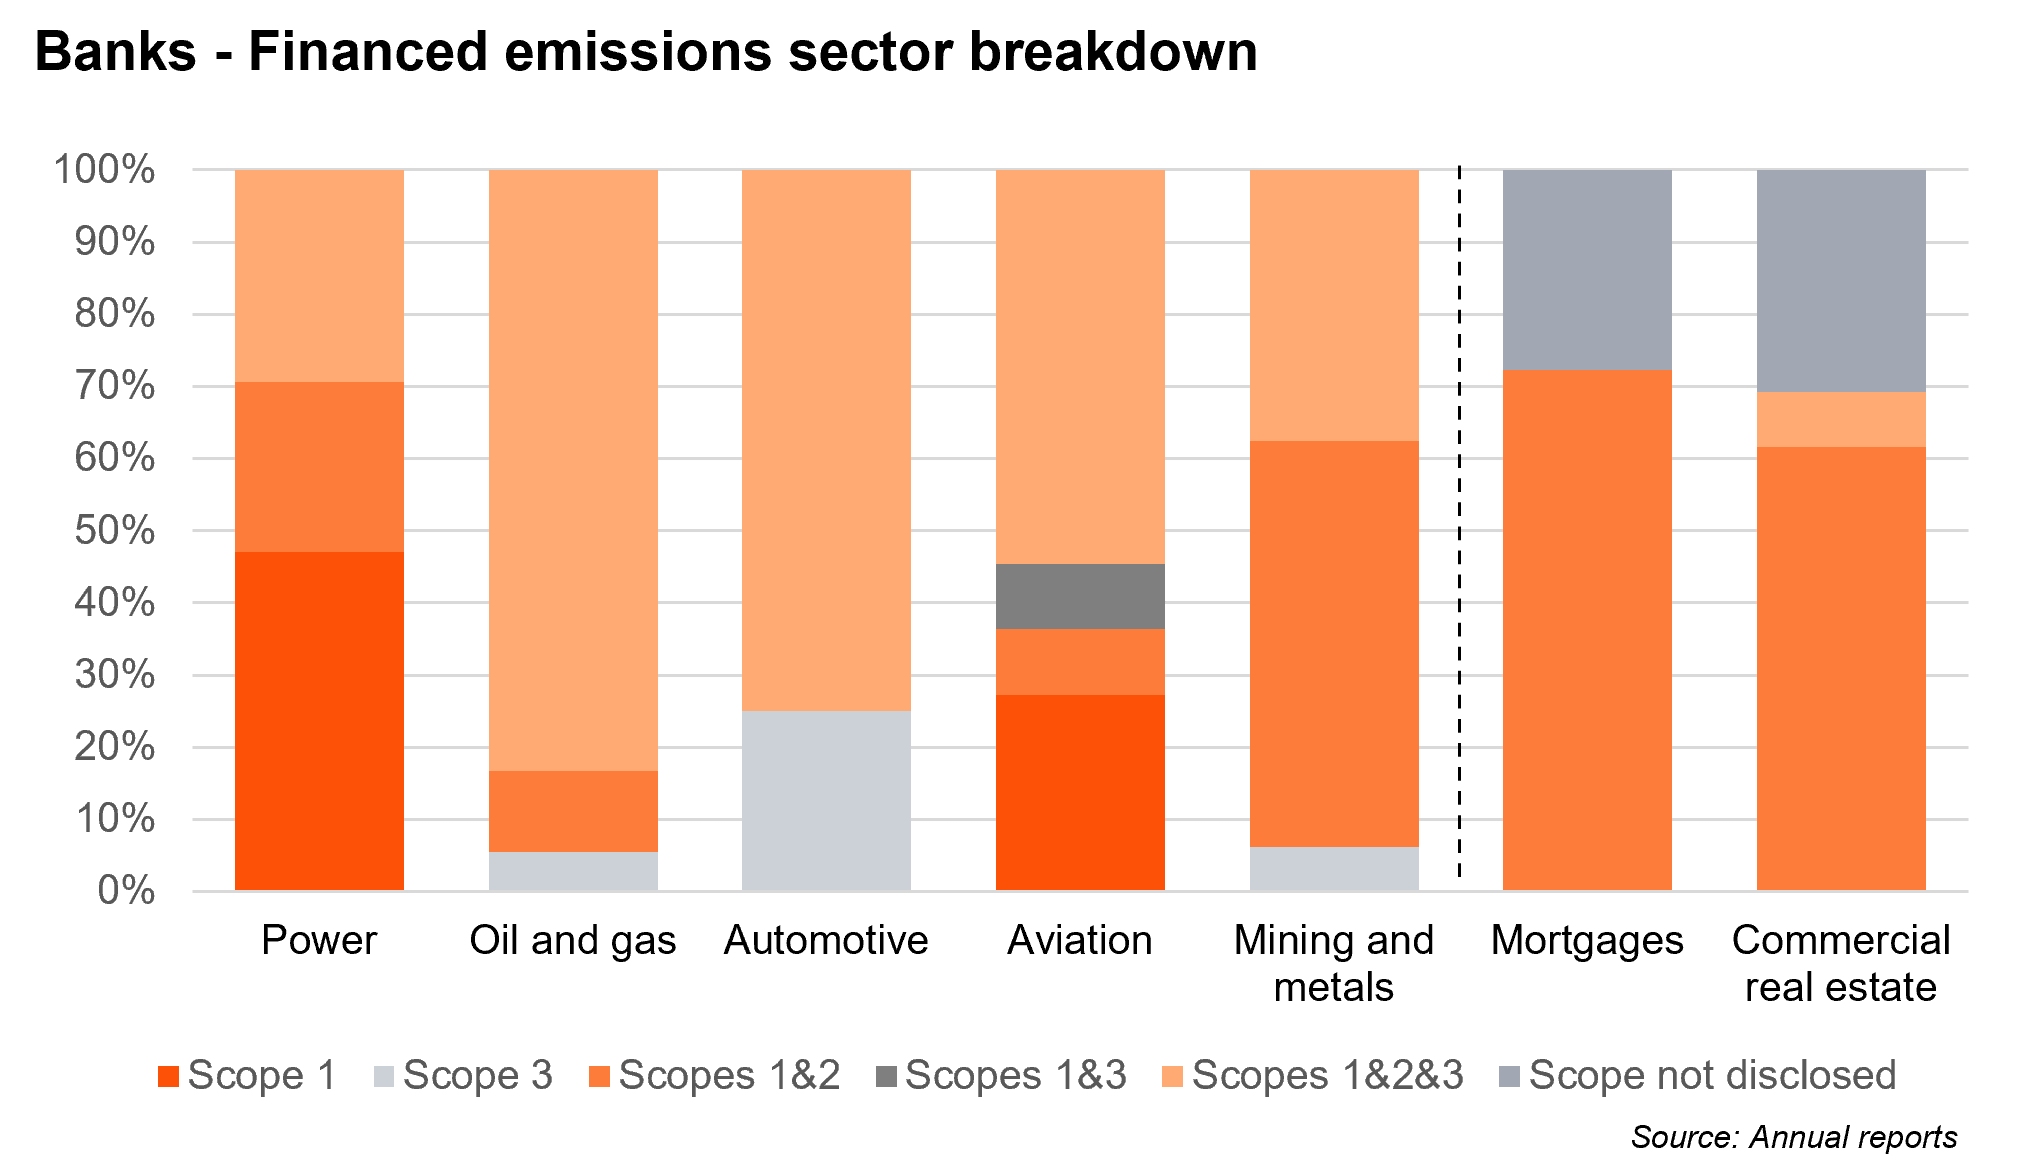
Banks - Financed emissions
- A significant proportion (69%) of the sample are now reporting all 3 scopes of emissions, across a range of sectors. Of the 7 most commonly reported sectors, only Mortgages has not had any Banks disclosing all scope coverage.
- The only asset classes/sectors to not consistently disclose the scope of emission coverage was Commercial real estate and Mortgages.
- This shows a drive towards comparable, transparent reporting, a trend we would expect to continue in the coming years.
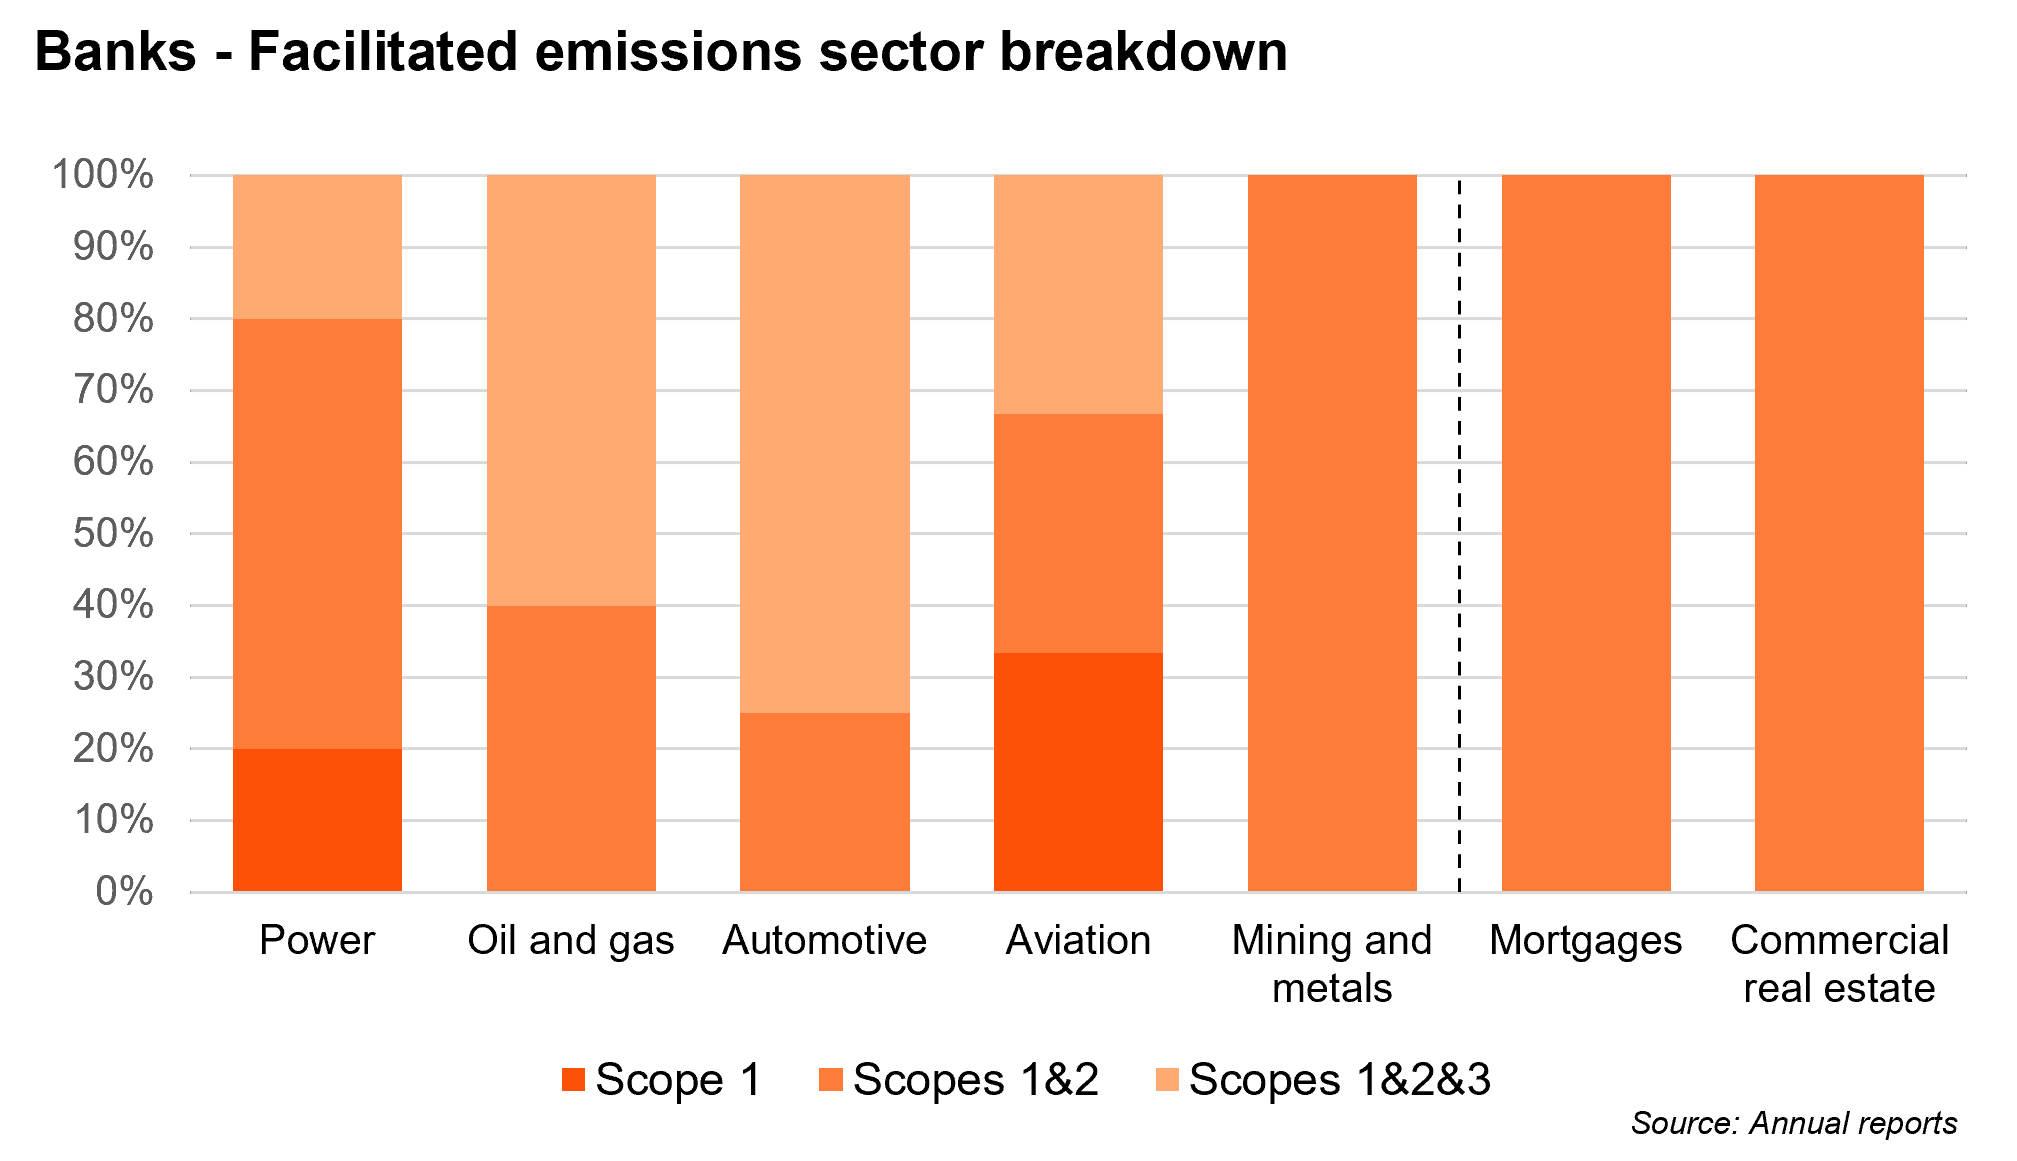
Banks - Facilitated
- For the Oil and Gas and Automotive sectors, the majority of Banks have included at least scope 1 and 2 emissions.
- Since YE 23 in Automotive and Aviation, a significant proportion of the sample have included scope 3 emissions within their disclosures.
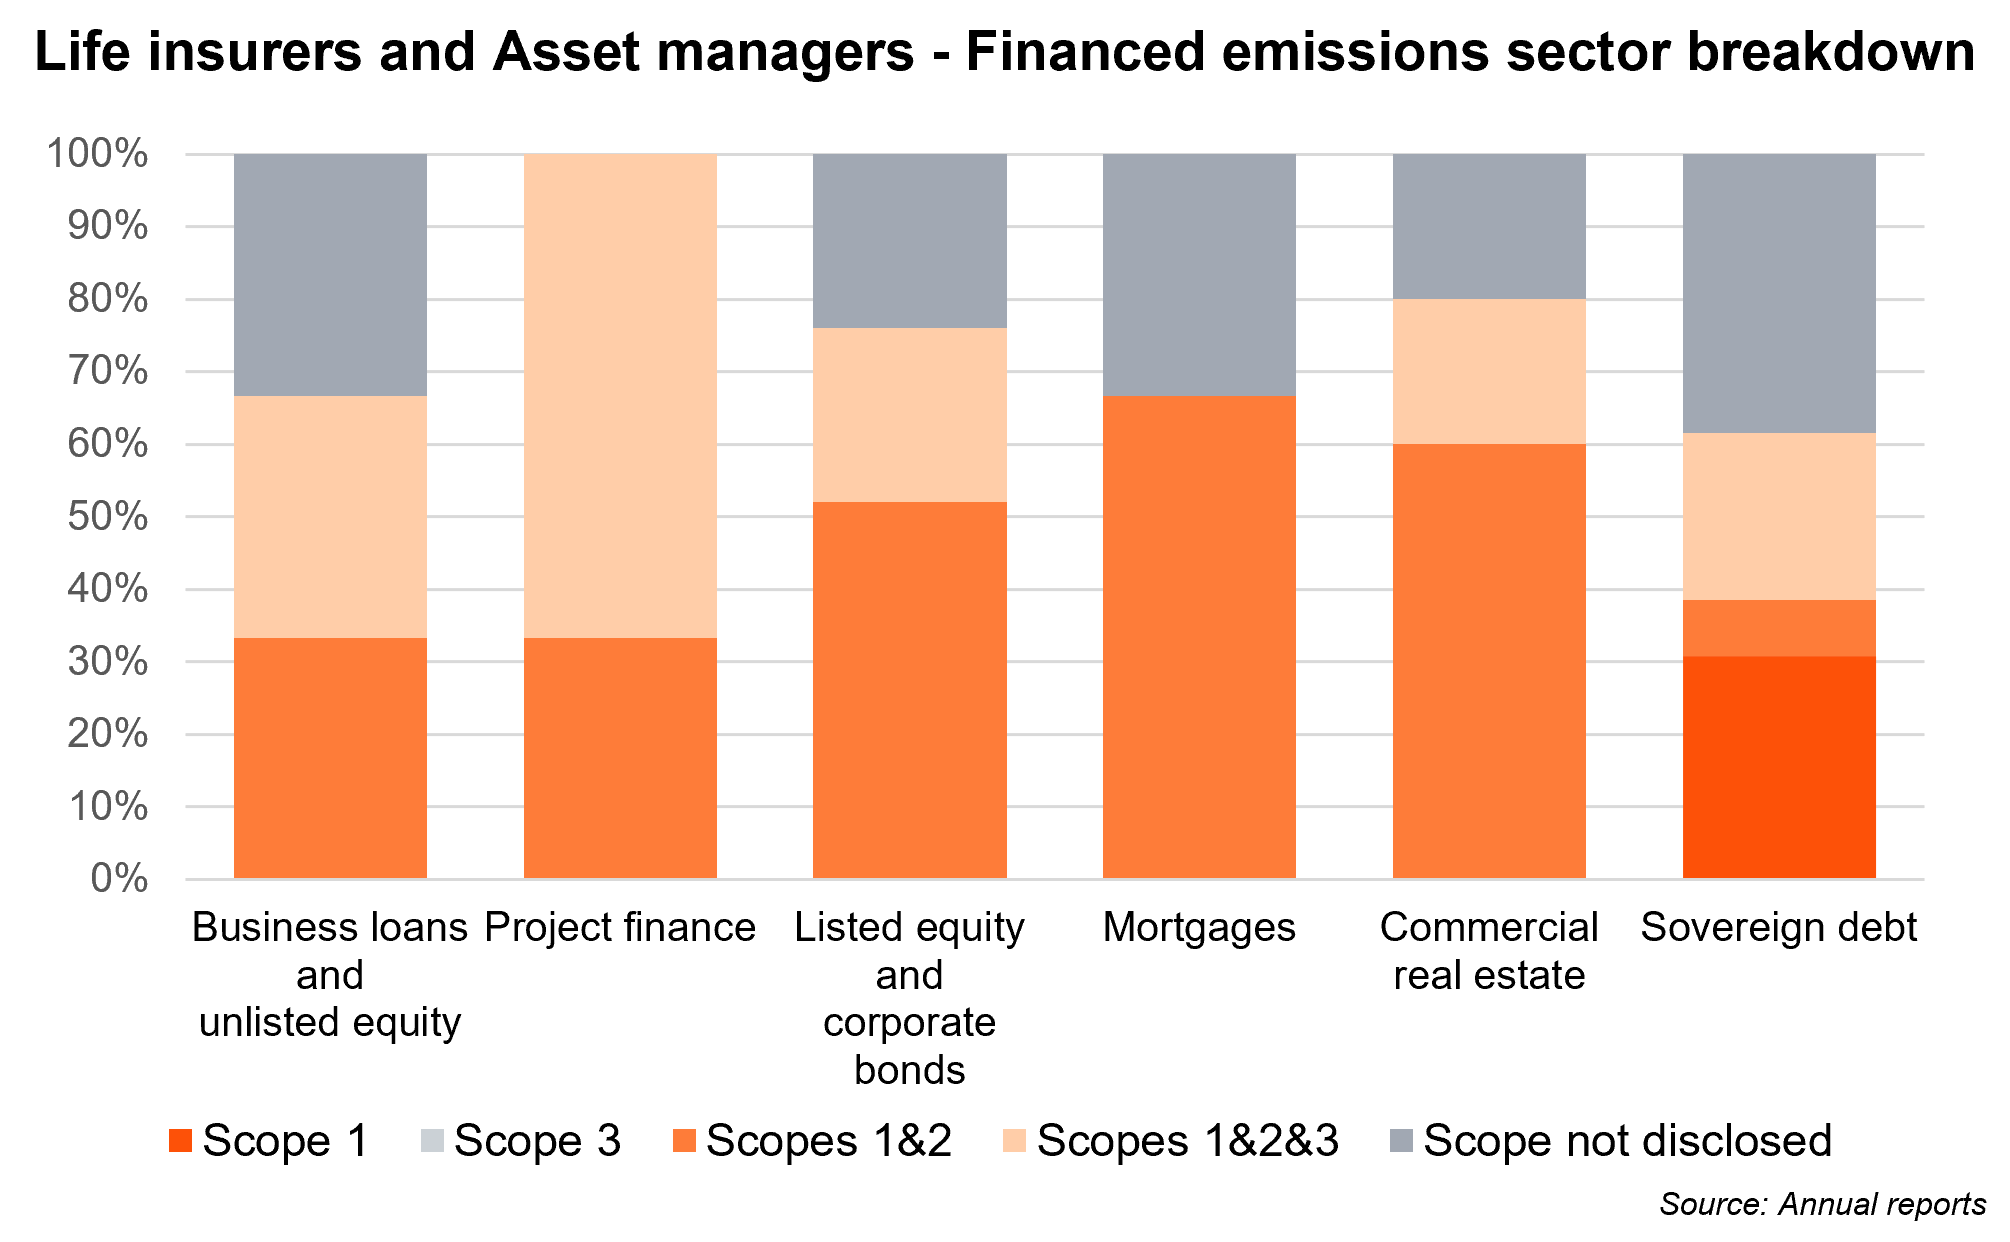
Life Insurers & Asset Managers
- Where disclosed, all institutions have reported scope 1 and scope 2 financed emissions, with the exception of the sovereign debt sector asset class.
- Disclosure of the scope of emissions included in their in-scope asset classes is less common than the Banking sample.
Sector level value chain considerations
Banks
- The upstream elements of the value chain have continued to be most commonly reported within the Oil and Gas and Power and Utilities sectors. This is in-line with expectation due to most Banks implementing a phased approach prioritising the highest emitting part of the value chain for those industry segments. As data-availability improves we would expect the level of reporting across the other value chain segments to increase, this trend is generally observed in comparison to the YE23 benchmark.
- Value chain coverage remains fairly consistent since YE 23 for the Automotive and Metal and mining sectors. Midstream activities are almost always included since these correspond to manufacturing and is the most carbon intensive area of the value chain, noting we have started to see some downstream reporting within metals and mining.
Life Insurers & Asset Managers
- We note that the value chain information is not disclosed by Life Insurers & Asset Managers since most of them have not disclosed sector level information.
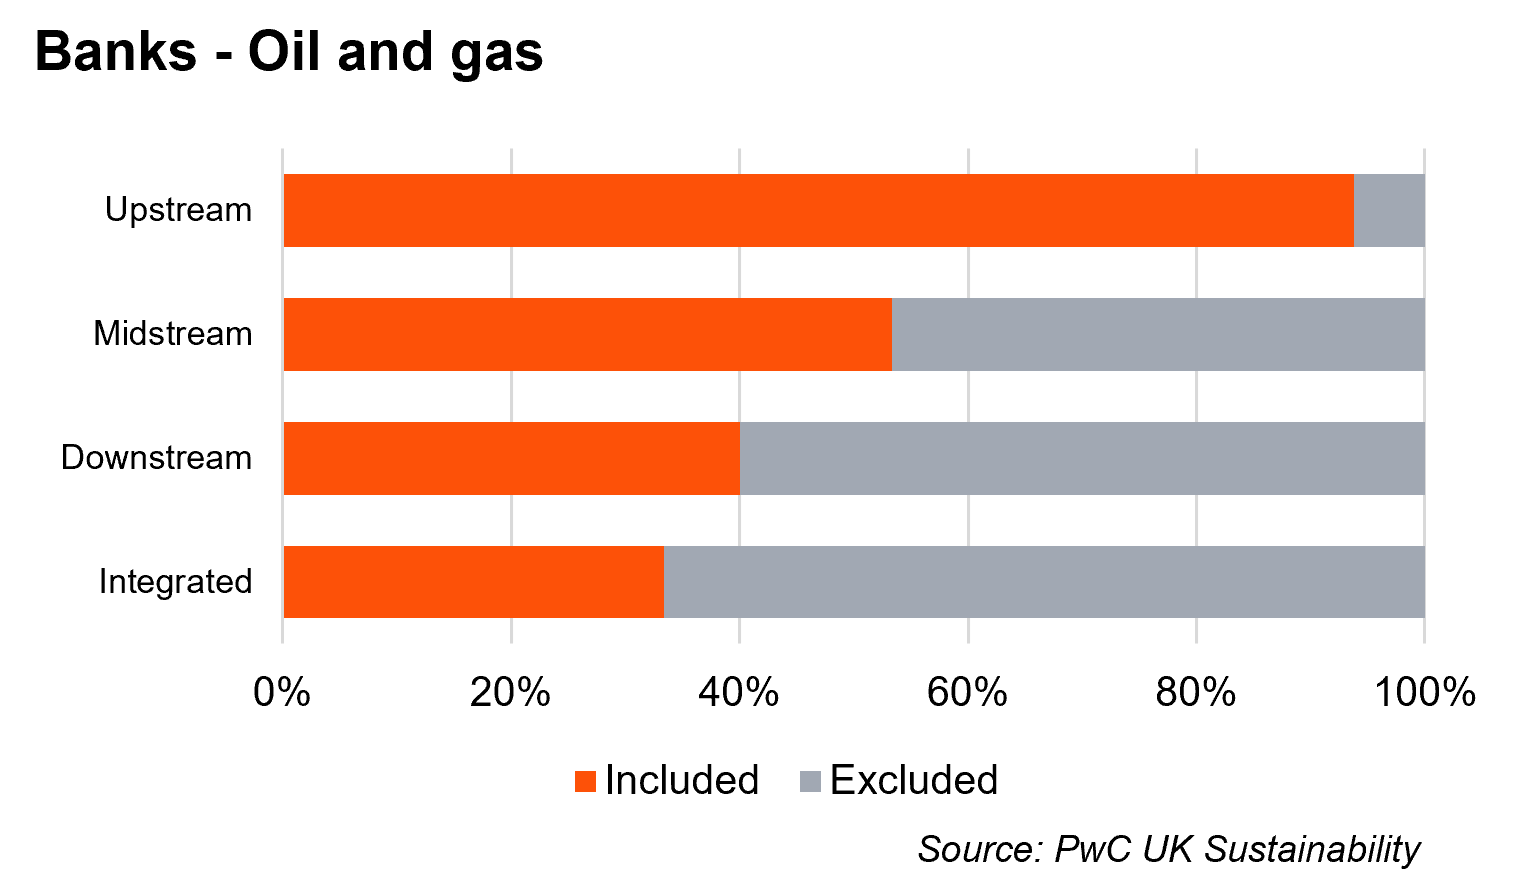
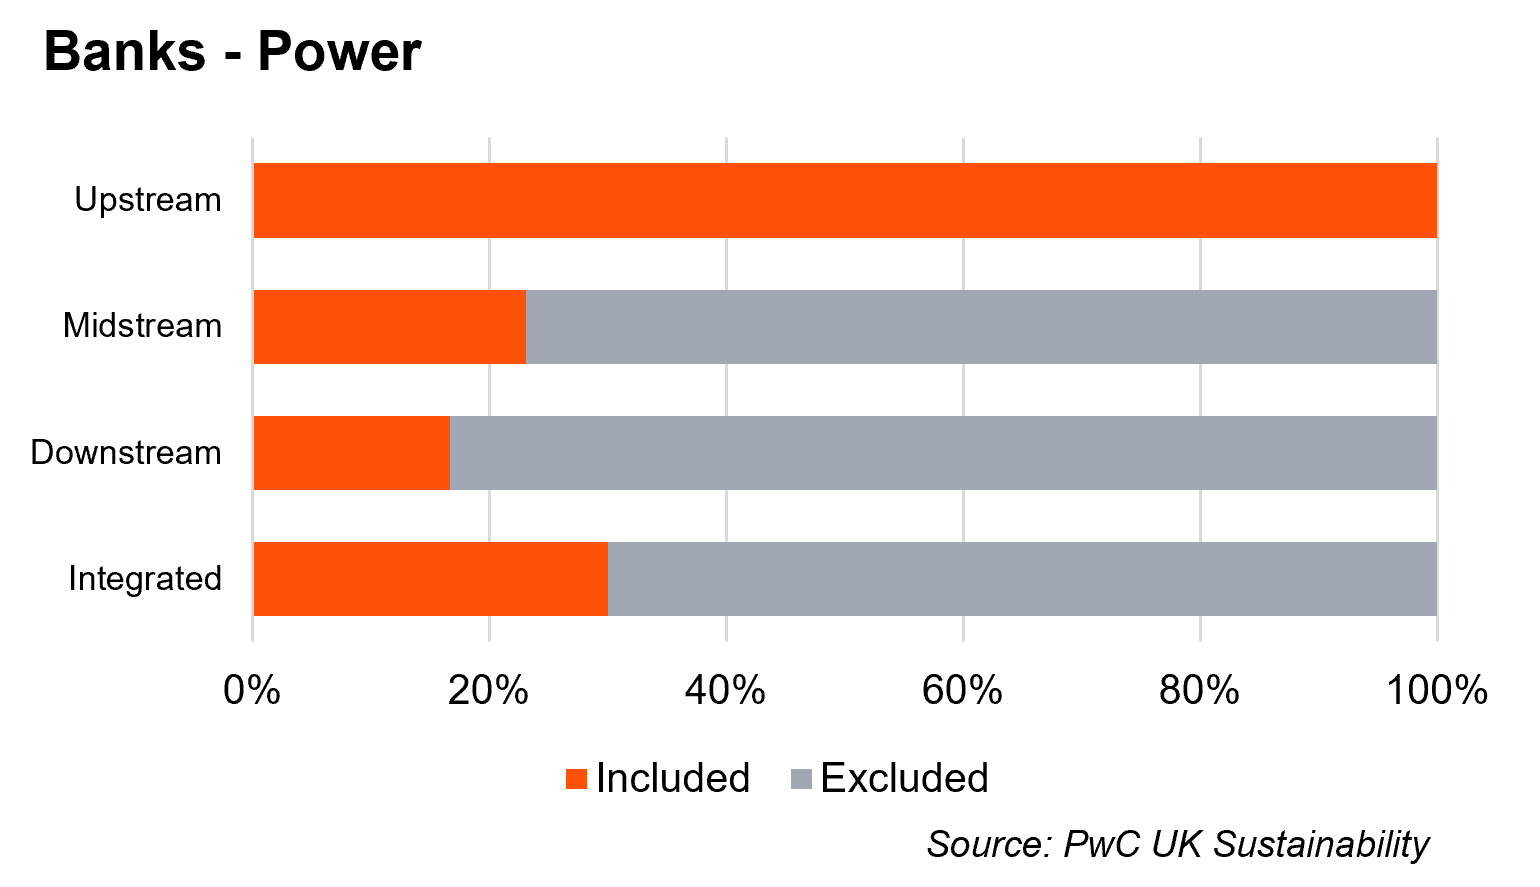
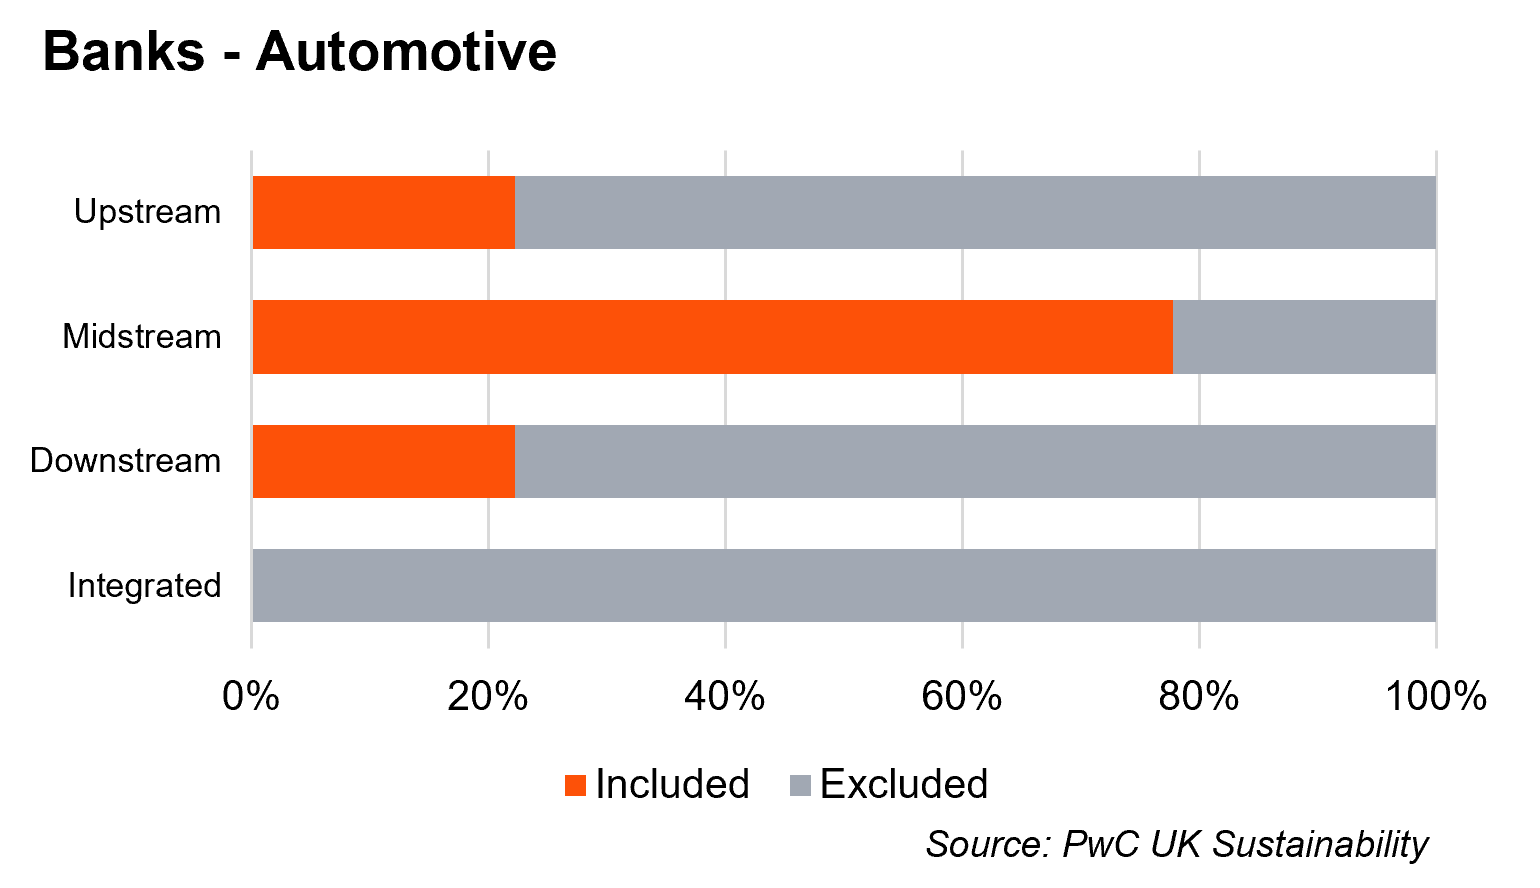
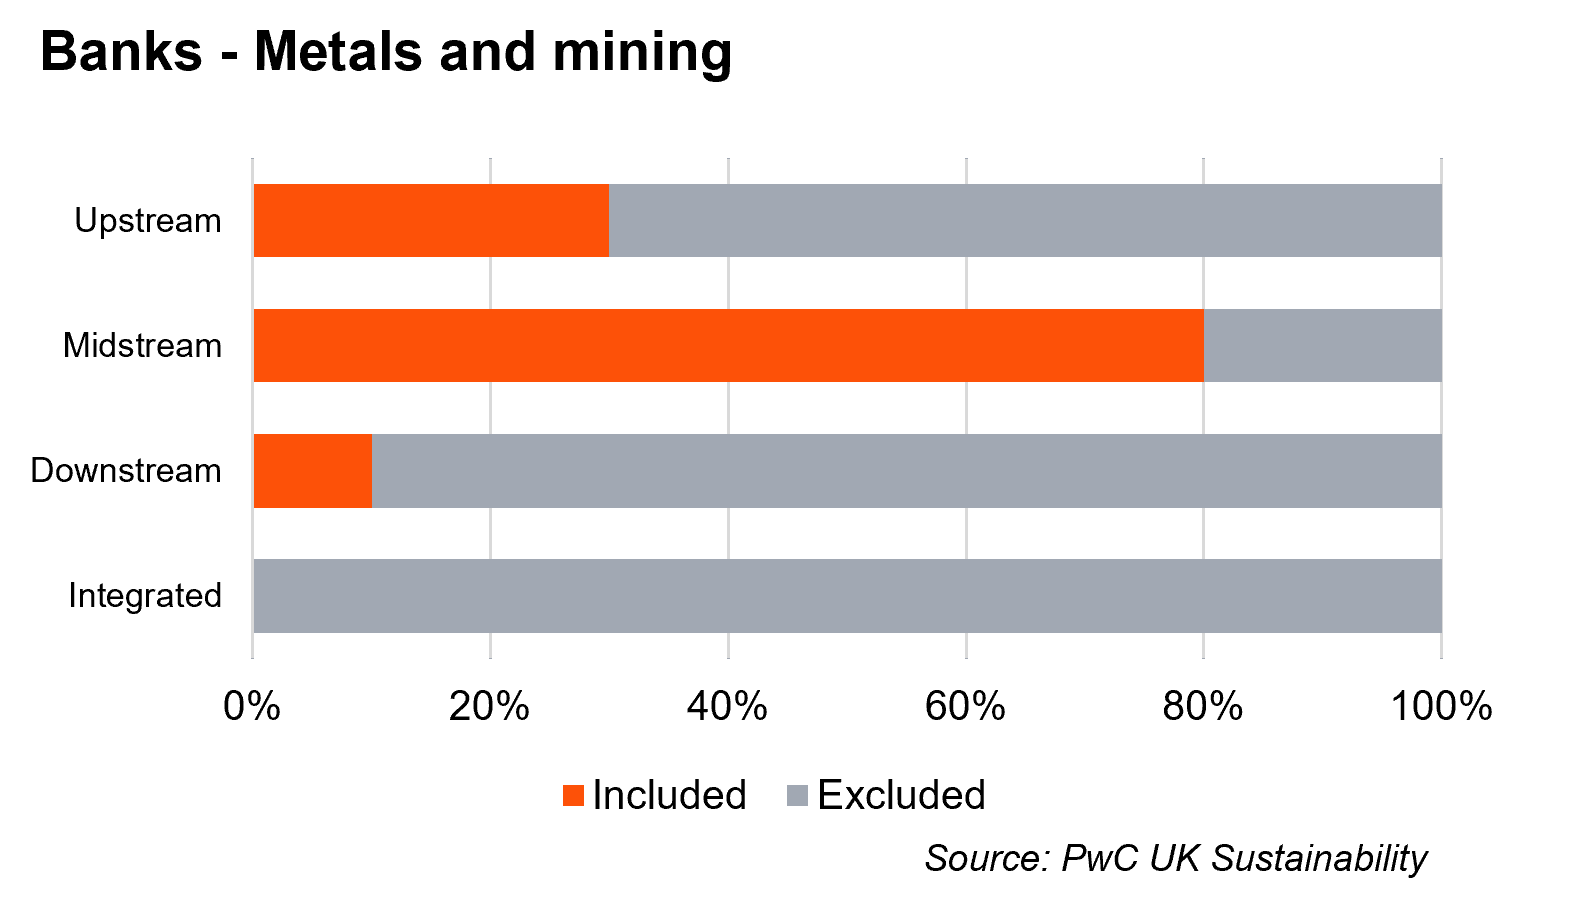
To ensure comparability, we have included only those sectors which are covered by most of the Banks, namely Oil and Gas, Power and Utilities, Automotive and Mining and Metals sectors, which are also the highest emitting sectors. Additionally, we note that the concept of value chain in the context of financed emissions does not apply to mortgages and CRE.
3. Data: Driving the evolving landscape
- Growing data availability is clear with participants reporting average PCAF data quality scores of ~2.5 to 3.5 for their most material sectors, an improvement on prior benchmarks. This reflects both an increased availability in better quality data, along with a clear effort by institutions to enhance data quality and refine methodologies. This is in line with broader sector trends toward more robust financed emissions reporting.
- Disclosure of data providers is also becoming more common, helping to increase transparency given the long-standing concerns around the "black box" nature of emissions estimates.
PCAF score
Data quality score – Banks
Overall
96%
Of the selected Banks disclosed a PCAF data quality score across any sector. Noting this increase on the 92% of the sample following PCAF guidance, this is due to a bespoke methodology bank providing PCAF metrics in the appendix for ease of comparison.
Oil & gas
3.2 and 3.5
Are the mean Scope 1 & 2 and Scope 3 PCAF data quality scores respectively in Oil & Gas across the Bank sample.
Power
3.2 and 3.6
Are the mean Scope 1 & 2 and Scope 3 PCAF data quality scores respectively in Power across the Bank sample.
Mortgages
3.7
Is the mean Scope 1 & 2 PCAF data quality score in Mortgages across the Bank sample.
Data quality score – Life Insurers & Asset Managers
Overall
48%
Of the selected Life Insurers & Asset Managers disclosed a PCAF data quality score across any sector.
Listed equity & corporate bonds
2.3 and 2.9
Are the mean Scope 1 & 2 and Scope 3 PCAF data quality scores respectively in Listed equity & corporate bonds across the Life insurer and Asset manager sample.
- For most sectors and asset classes, we continue to see a wide range of PCAF scores, highlighting that financial institutions are relying on varying data sources and methodologies—ranging from proxies to verified emissions data—to calculate their financed emissions. However, we can observe improvement in mean PCAF score from the YE 23 benchmark, in every featured sector below (except sovereign debt). This suggests that data availability is improving, and institutions are actively seeking improved data & methodologies.
- We observed that Mortgages have a small range of PCAF scores and averaging between a score 3 and 4. This suggests that property level energy efficiency proxies are prevailing with no participant using an actual consumption approach (i.e. PCAF score 2).
- For the Oil & Gas sector we see a large range in PCAF scores, suggesting a range of approaches from unverified emissions, to proxies in the form of production, revenue and asset intensities being leveraged.
- Interestingly, Mining and metals and Sovereign debt are the only sector/asset class where the minimum PCAF score is close to 1, suggesting that some FI leveraging verified emissions for these sectors.
Below we have summarized for the most material sectors/asset class the range of PCAF data quality scores in the following box whisker plots:
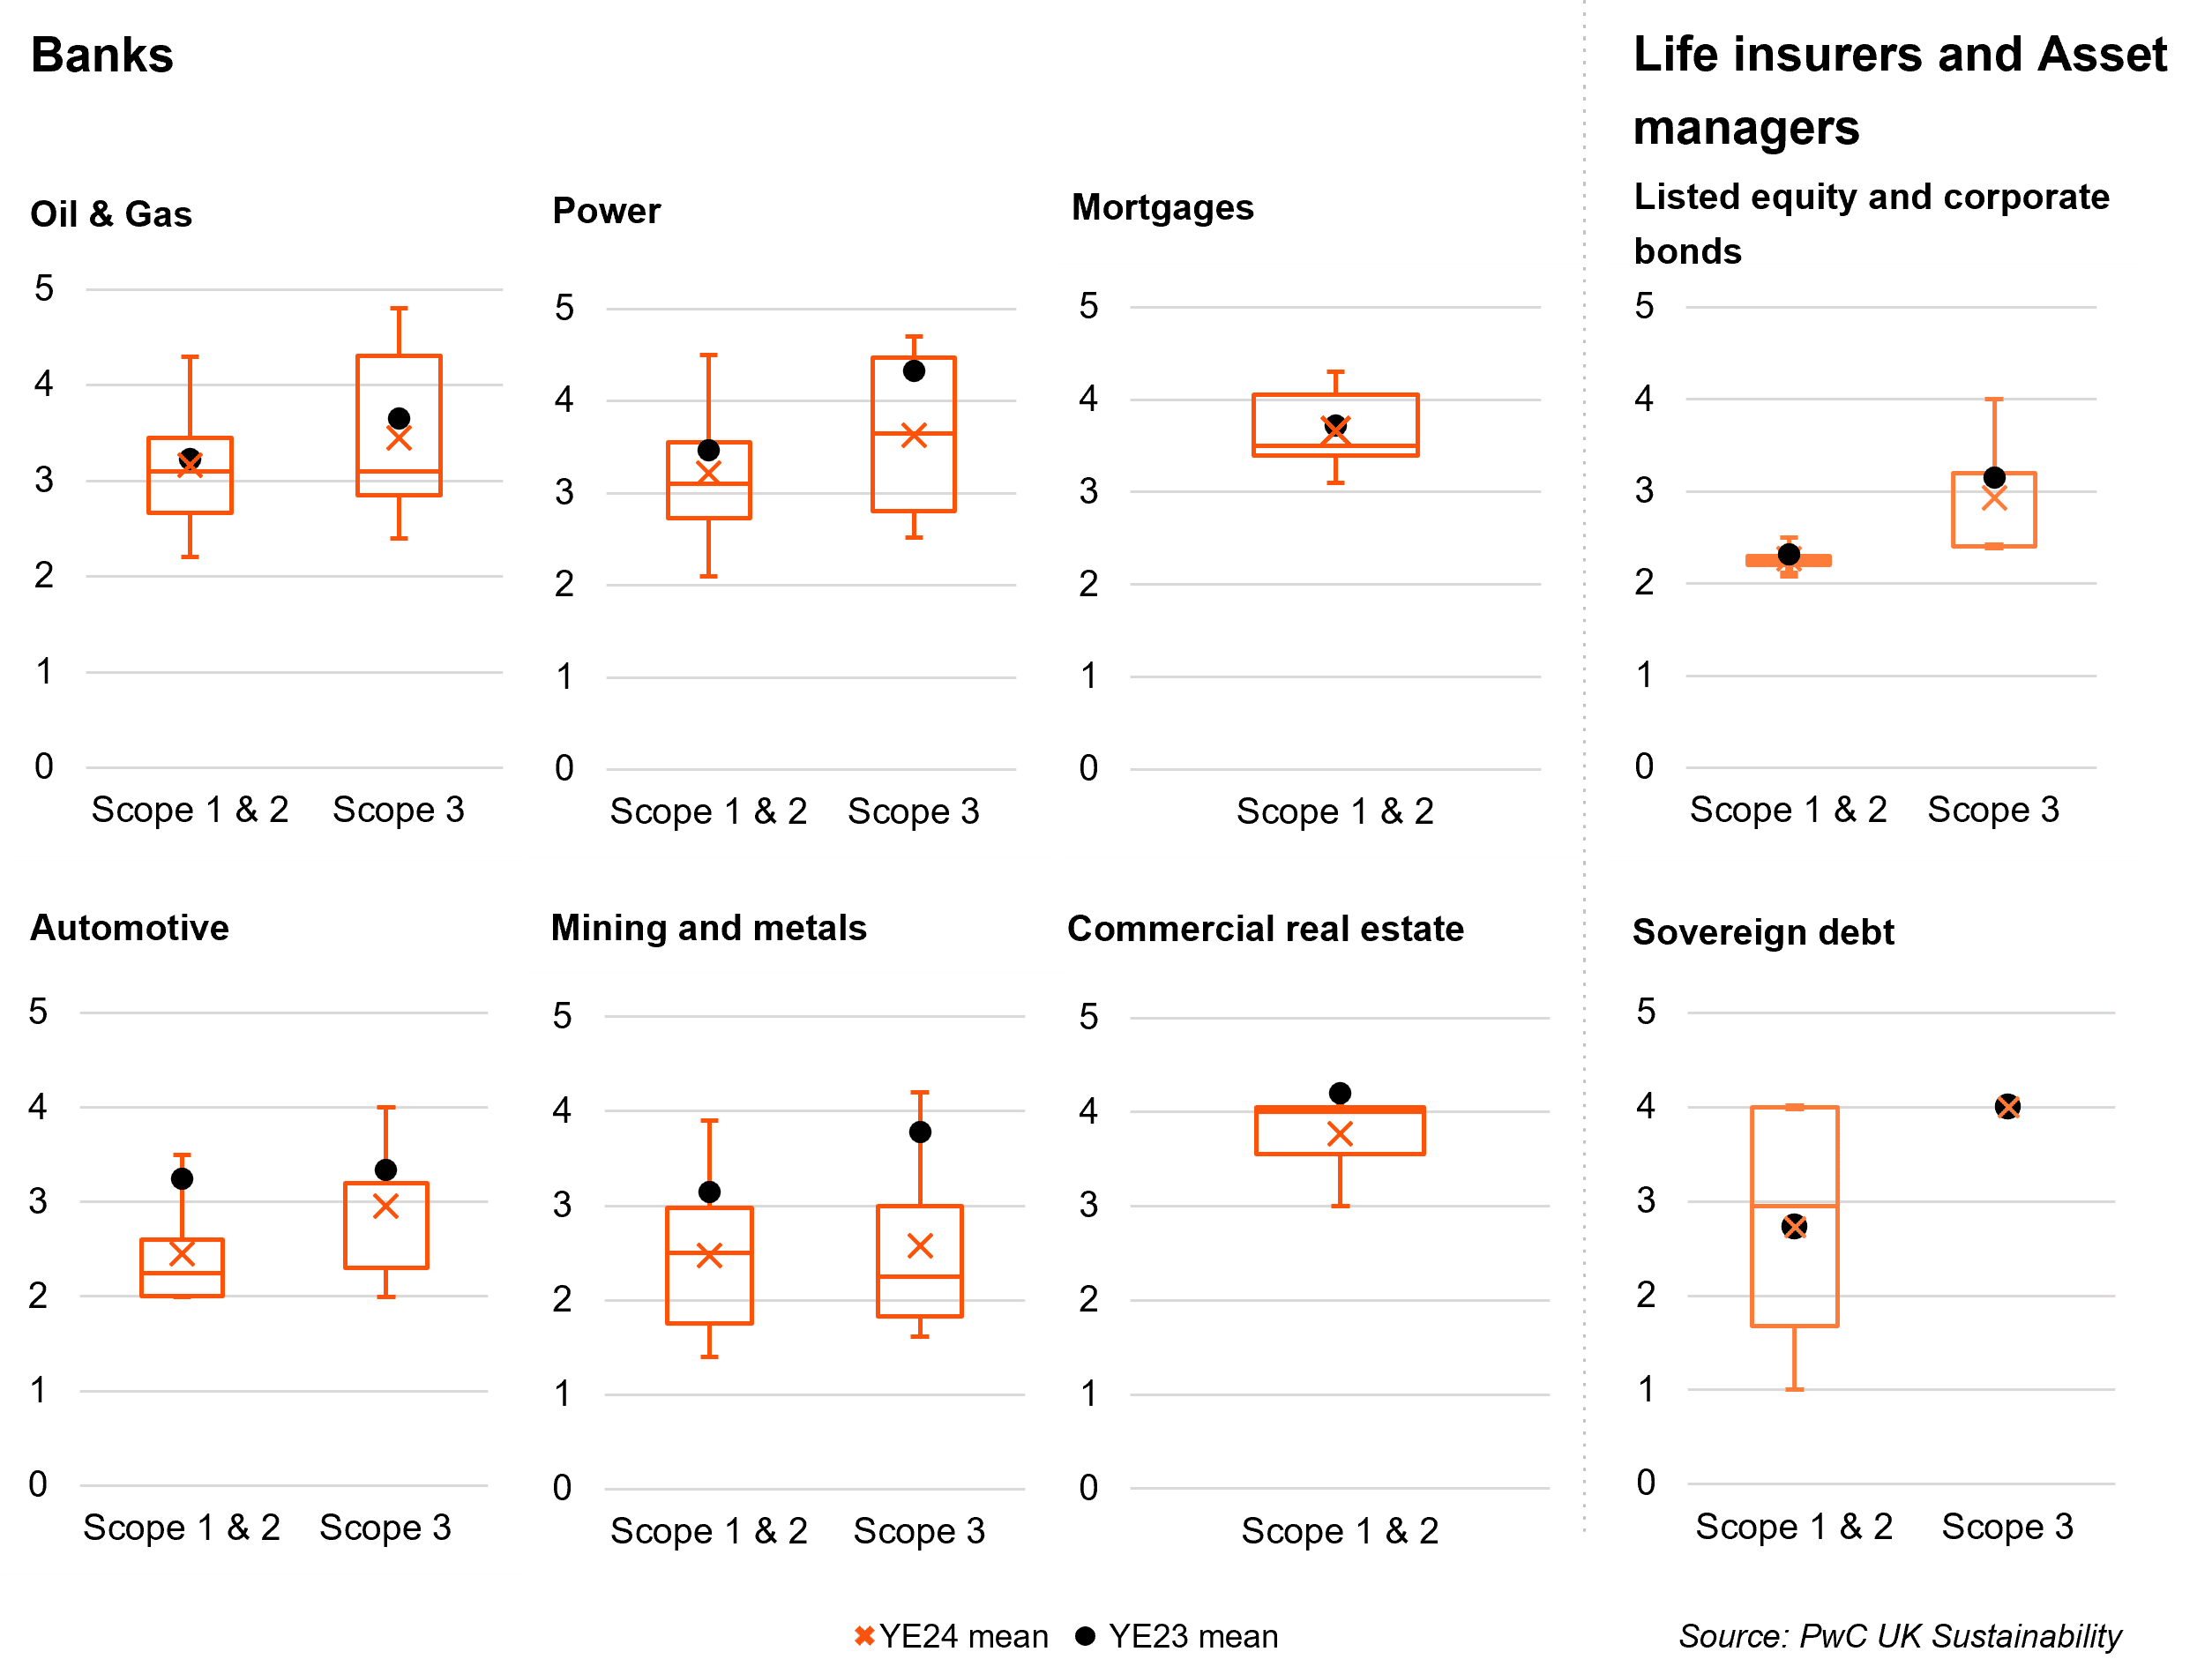
To ensure comparability, we have focused on sectors and asset classes which are widely covered by most institutions, namely Oil and Gas, Power and Utilities, Automotive and Mining and Metals sectors. Additionally we have considered the Commercial Real Estate and Mortgages asset classes, which have seen a growing number of disclosures. For Life Insurers & Asset Managers we have included the Listed equity and corporate bonds and Sovereign debt asset classes.
Data providers
- The PCAF database is the most popular disclosed source for Banks and in the top 5 for Life Insurers & Asset Managers. While this database obviously has the advantage of being provided by PCAF itself, it provides proxies across multiple PCAF score methodologies and is fed data from other sources (such as Exiobase) and hence may provide more of a ‘one-stop-shop’ incentive to FIs, hence it’s popularity.
- Overall, 62% of Bank and 76% of Life insurer and Asset manager participants included mention of data providers in their disclosures, however this was almost never consistent across all sectors/asset classes or an exhaustive list of data providers.
- Some data providers mentioned are tied to specific asset classes, such as EPC (which is specific to UK books) to CRE or Mortgages, and hence are unlikely to be disclosed by institutions without a large portfolio in these asset classes.
4. Target setting & decarbonisation strategy: Shaping your transition plan
- Looming interim portfolio targets are increasingly becoming a priority for financial institutions. 81% of Banks and 86% of Life Insurers & Asset Managers have now disclosed at least one interim target, signalling widespread baseline establishment and transition planning.
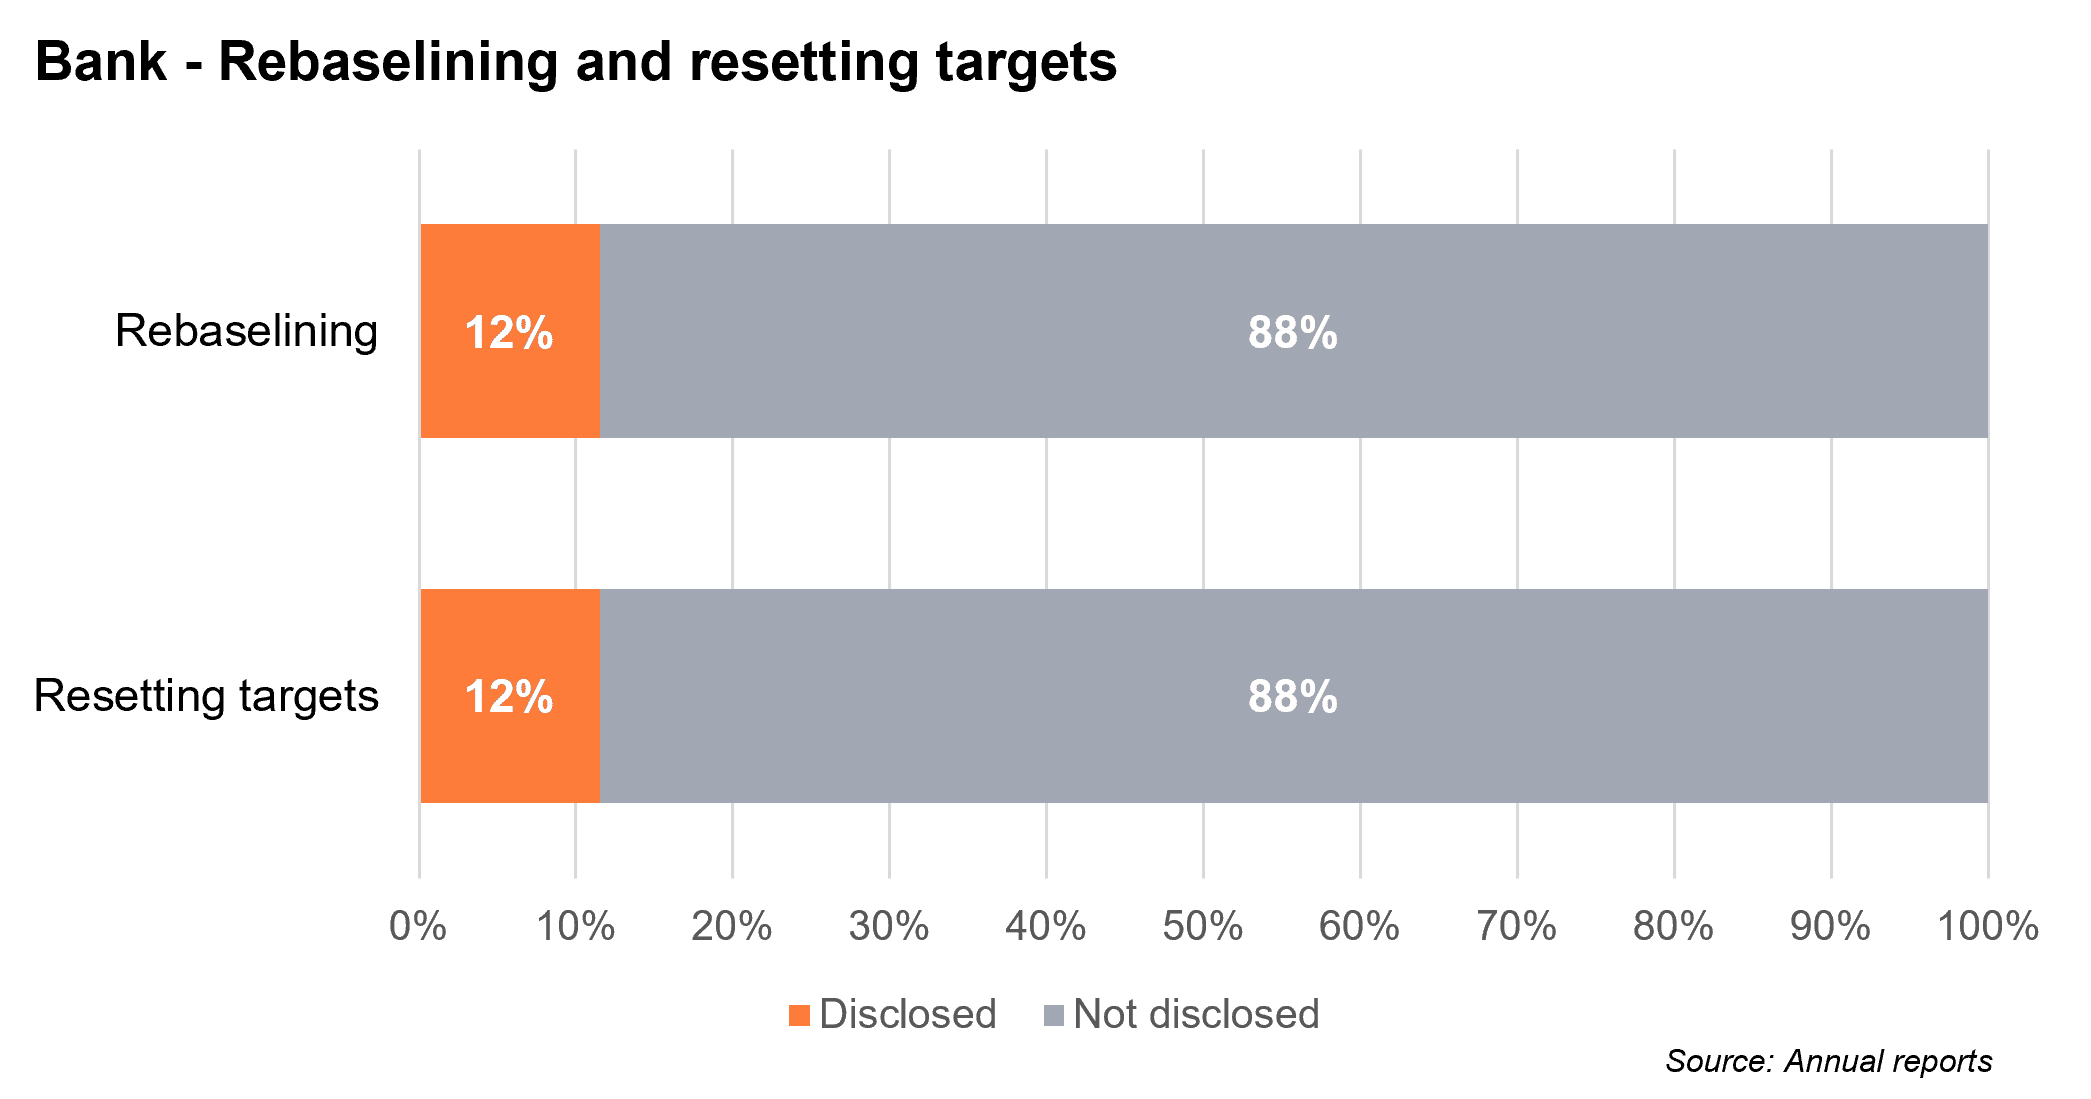
- Target restatement is emerging, with 12% of Banks resetting targets, a figure expected to rise due to variation and evolution in reference scenarios.
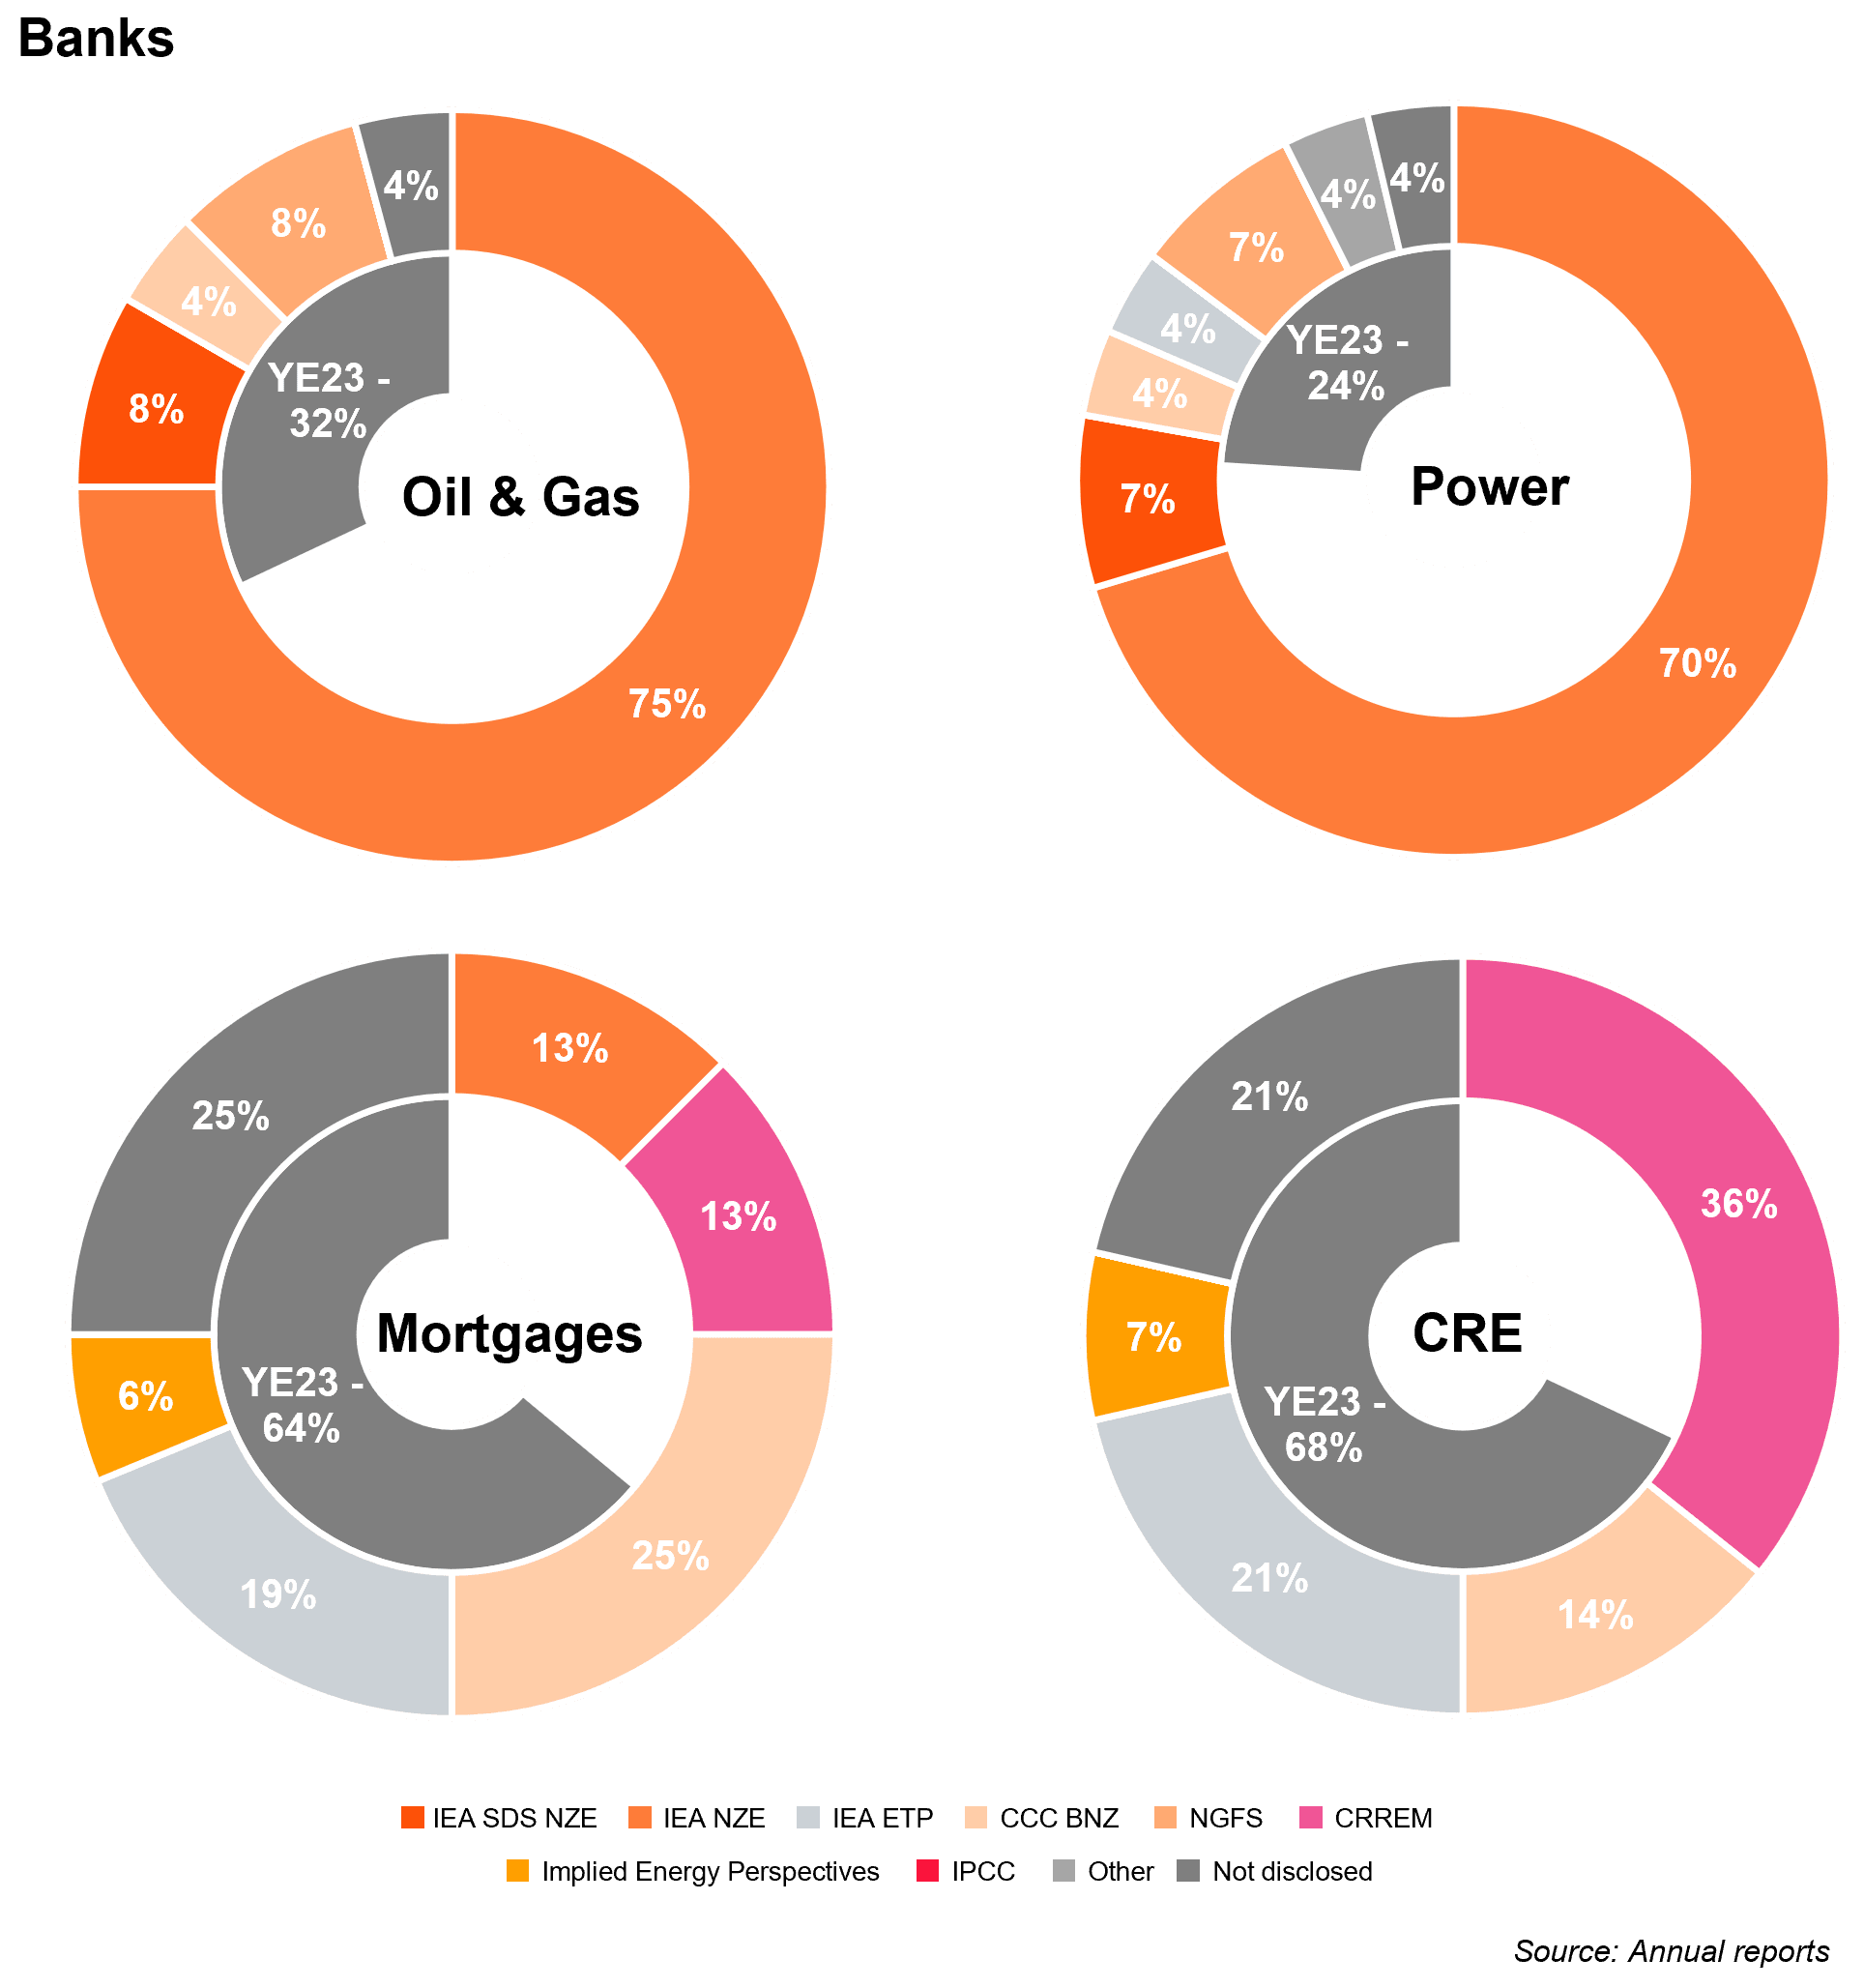
- Reference pathway disclosure has surged, with non-disclosure falling to just 4% for Oil & Gas and Power sectors, reflecting growing strategic clarity and transparency
Interim and Net Zero Targets
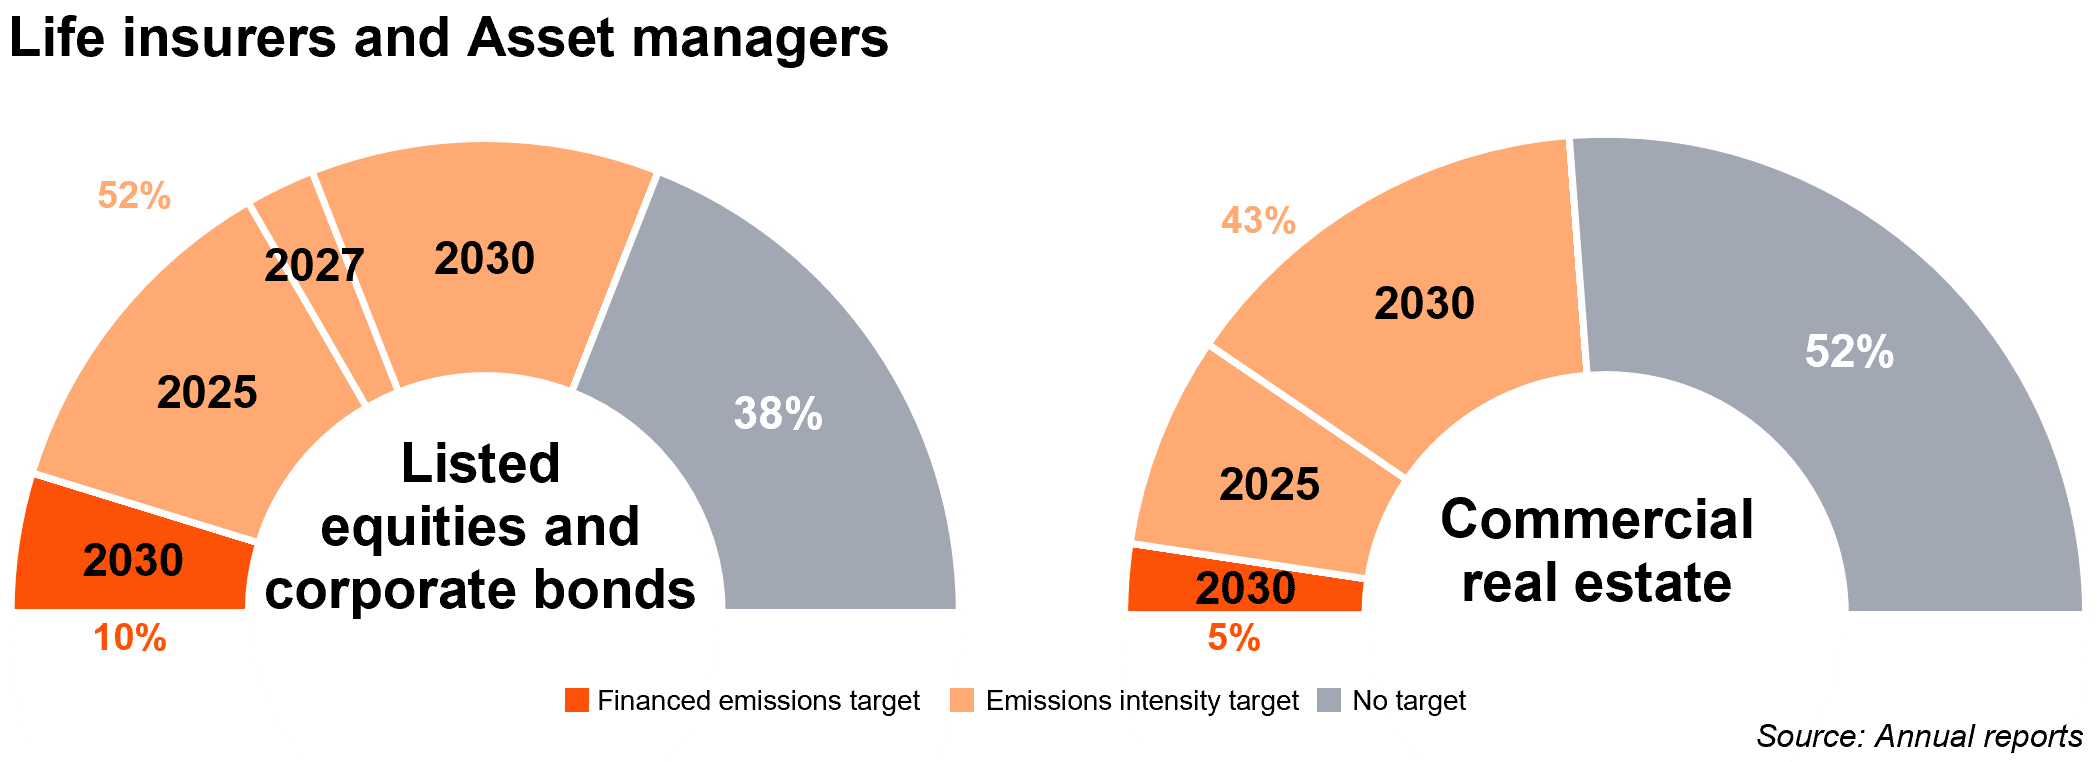
- Across all sectors/asset classes 81% of Banks and 86% of Life Insurers & Asset Managers within our samples have disclosed at least one interim target for their portfolio, while only 46% of Banks and 67% of Life Insurers & Asset Managers have disclosed at least one net-zero target.
- We have observed that Banks tend to offer a more comprehensive financed emission disclosures, the stats above show that the Life insurance and Asset management market may be ahead in terms of targets.
- We note that Banks are disclosing targets at sector level, while some Life Insurers & Asset Managers are disclosing a single target as opposed to multiple sector-specific targets.
- Across the majority of sectors we observe 2030 as the most common interim target year, however we note that the Life insurer and Asset Manager sample includes a broader range of interim target years than Banks.
- We have observed a trend in the use of production intensity targets as opposed to absolute emission targets across most sectors, with the notable exception of Oil & Gas. This divergence stems from the fact that production intensity in the Oil & Gas sector is inherently constrained—being a fuel-based industry, its emissions per unit of output cannot be significantly reduced through technological innovation or use of alternative methods.
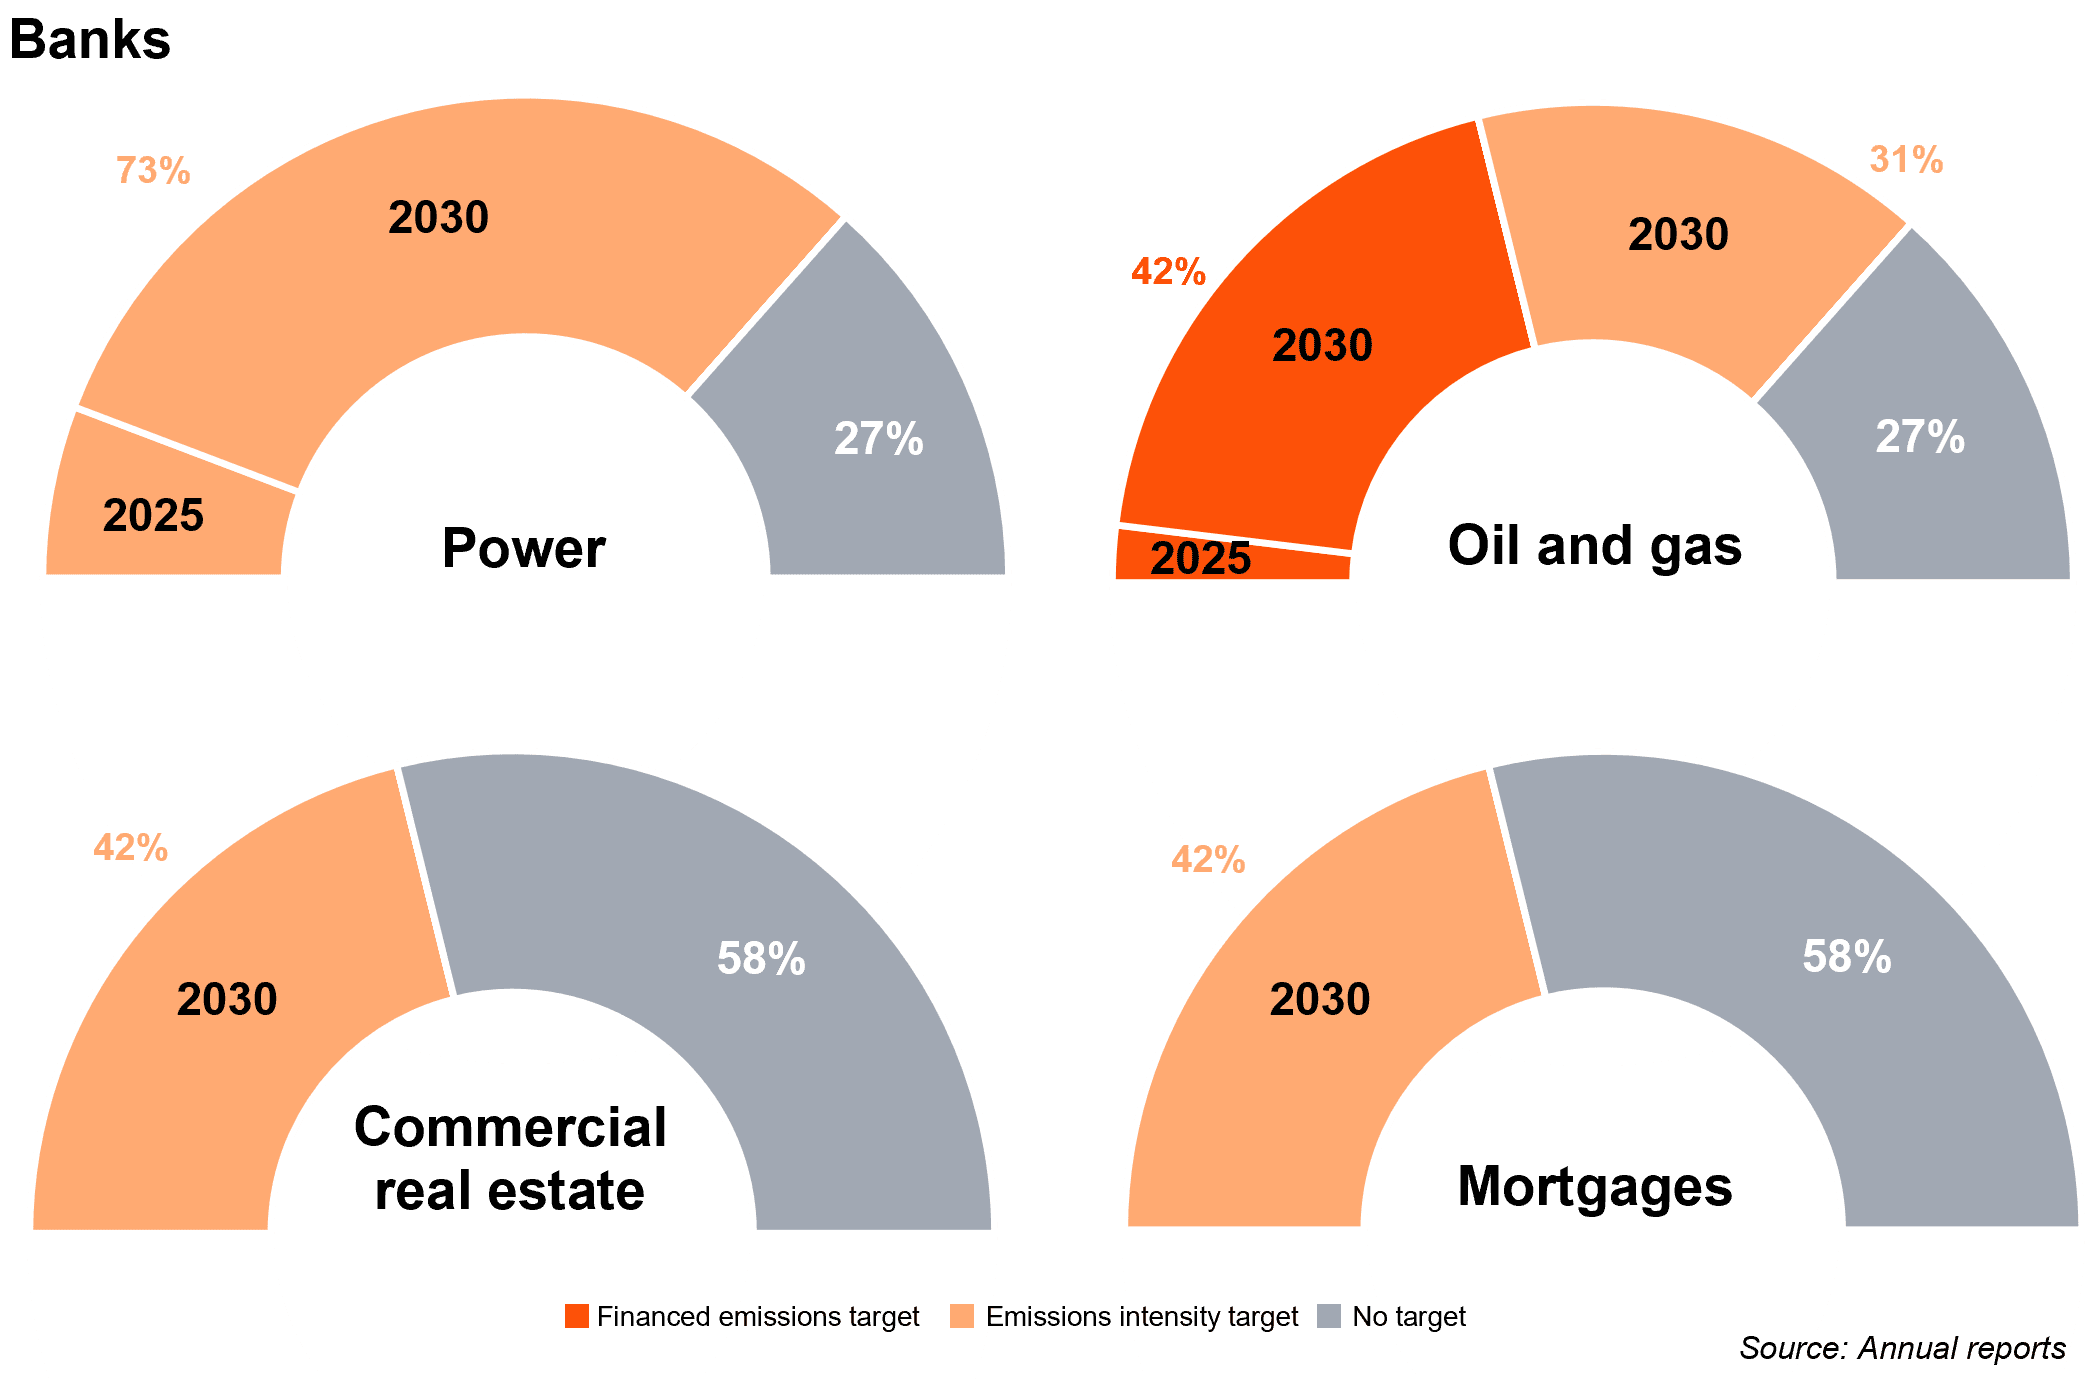
To ensure comparability, we have focused on sectors and asset classes which are widely covered by most institutions.
Target resets
Banks
- We’ve observed 19% of the Banks sample disclose a reset or rebaseline of a target. This is explored in more detail in the graph below. We might expect restatement rates to increase in coming years, as we approach 2030, an interim target year for many institutions.
- The act of re-baselining likely reflects: improved data quality, methodological refinements (e.g. better emissions tracking), or alignment with updated standards such as PCAF. This indicates Banks are actively iterating on their financed emissions strategies as they mature.
- Although disclosures rarely include a direct comparison between original and restated targets, from conversations with clients, we are seeing FIs will usually restate targets to align them to updated reference scenarios. This is often accompanied by disclaimers noting that the targets rely on assumptions - such as technological advancements - that are beyond the institution’s control.
- We anticipate that FIs will need to regularly review and adjust their targets over time in response to variation and evolution of reference pathways and the shifts in global net-zero commitments. We expect FIs to establish a robust transition plan that demonstrates the feasibility of these targets will enhance the credibility of both the decarbonisation strategy and the associated goals.
Life Insurers & Asset Managers
- Our underlying data has shown no Life Insurers or Asset Managers have re-baselined or reset targets so we have not included a graph below. However, we do expect Life Insurers & Asset Managers to abide by the same standards in terms of target setting as Banks i.e. have a robust restatement policy.
Reference pathway selection
- Across all sectors, for both Banks and Life Insurers & Asset Managers, we have seen a significant increase in the number of institutions disclosing a reference pathway since the YE 23 benchmark.
Banks
- Fewer Banks disclosed reference pathways for Mortgages and Commercial Real Estate compared to Oil & Gas and Power & Utilities (75%, 79%, 96%, 96% respectively).
- We also observe that reference pathway selection is much more varied within Mortgages and Commercial Real Estate, with 4 and 5 different pathways, respectively, achieving over 10% sample share.
- Other sectors/asset classes include far fewer reference pathways. This reflects Banks that have not set targets for other sectors/asset classes as well as Banks that have not used reference pathways to set their targets. We note, in some cases reference pathways do not yet exist for specific sectors/asset classes.
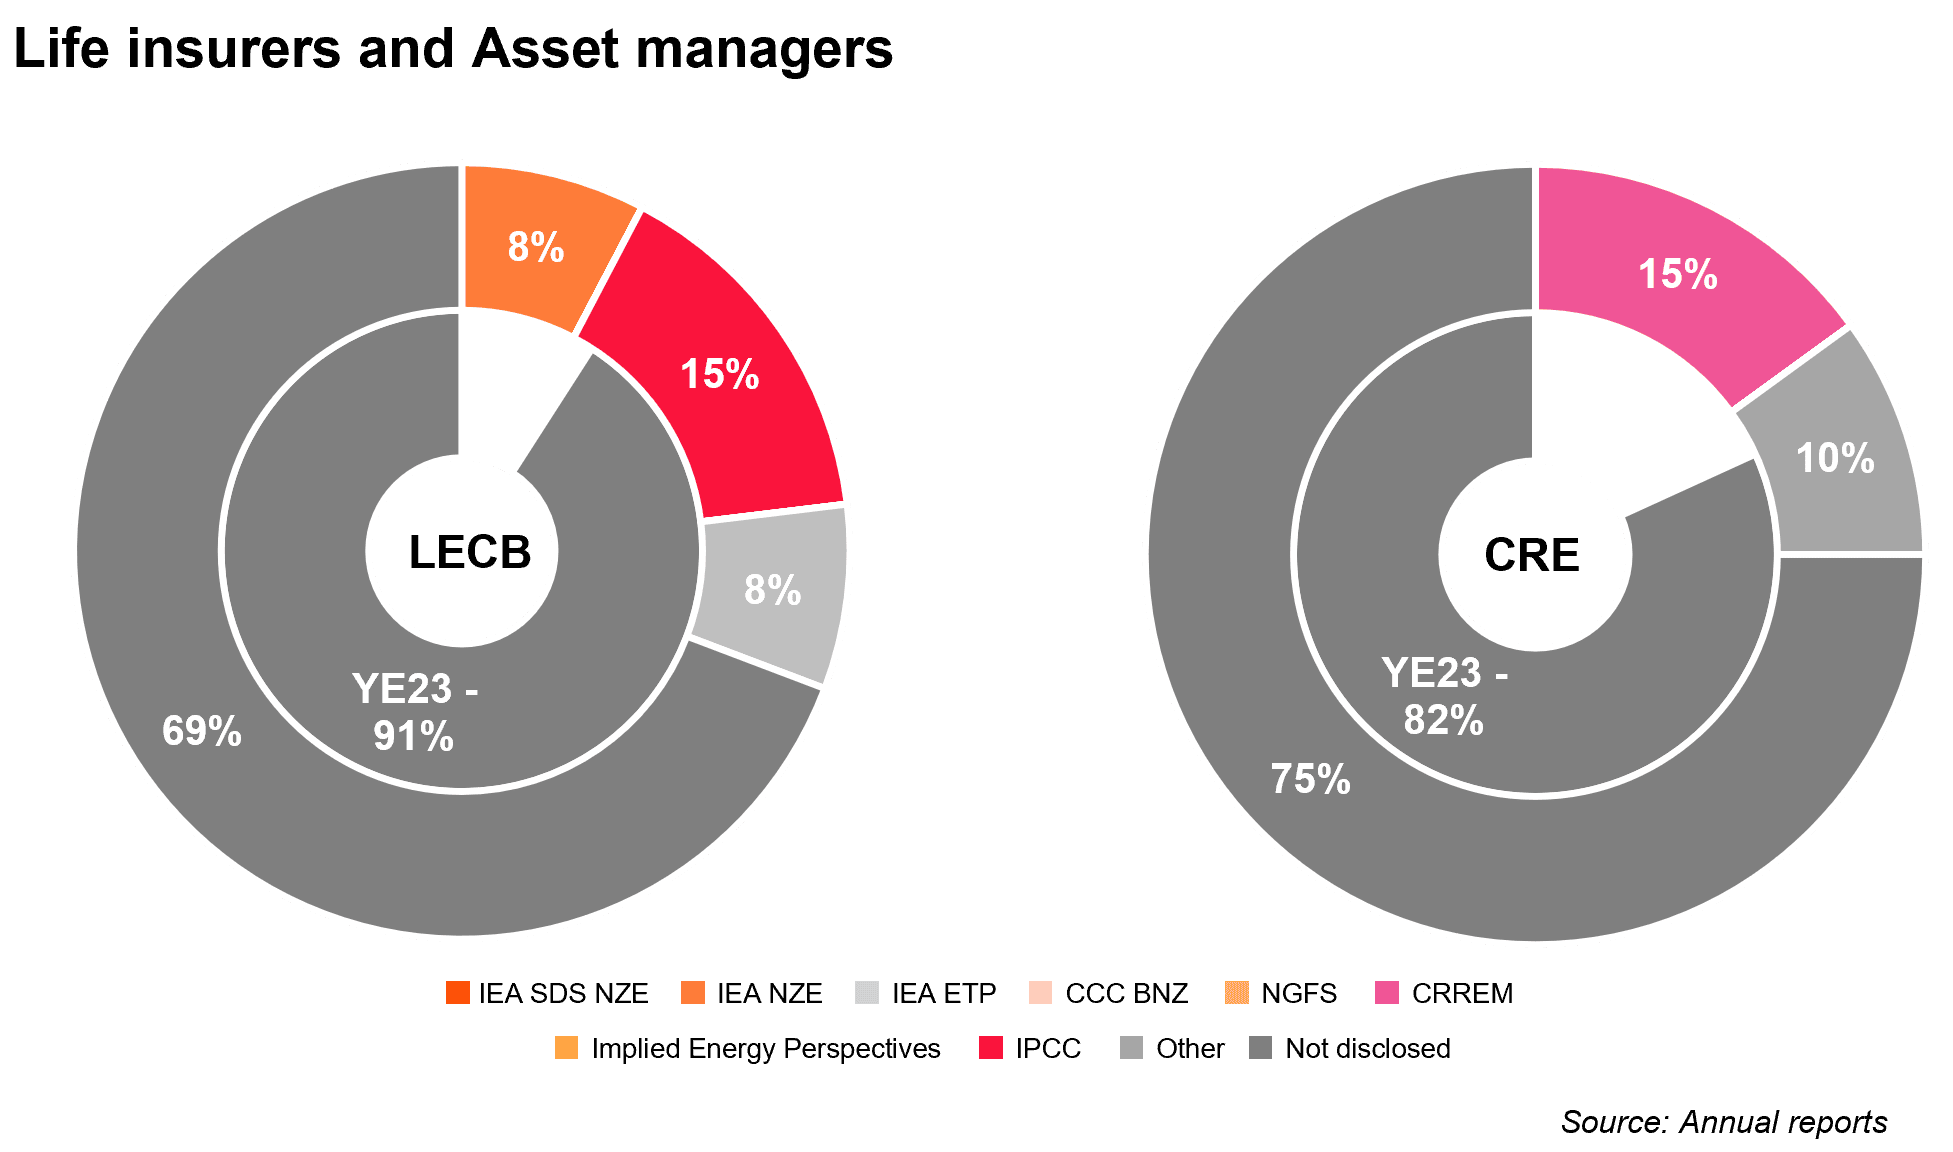
Life Insurers & Asset Managers
- Far fewer Life Insurers & Asset Managers (14% of participants) have disclosed a reference pathway across any sector/asset class, in comparison to Banks (73% of participants), as shown in the graphs below. However, as previously noted there is still a significant increase in reference scenario disclosure from the YE 23 benchmark.
YE24 Financed emissions benchmarking
GHG Emissions Analyser
To explore the full benchmark dataset and gain access to our comprehensive GHG Emissions Analyser, please reach out to our team.
How PwC can help you in your sustainability journey

Sustainability reporting
- Gap assessment.
- Define reporting framework.
- Implement and refine.
- Ensure assurance readiness.

Emissions modelling & climate stress testing
- Maturity assessment and level setting.
- Emissions baseline.
- Stress testing.
- Risk management frameworks.

Transformation roadmap & implementation
- Transformation roadmap development.
- Supply chain and procurement.
- Operations and logistics.
- People and culture.
- Data, technology and cyber.
- Operations and logistics.

Data sourcing & processing
- External data selection and processing.
- Sensitivity and benchmarking analysis.
- Proxy sourcing and/or calculation.

Strategy development & transition planning
- Decarbonisation strategy and optimisation.
- Portfolio and counterparty management.
- Risk appetite.
- Transition planning.
- Credit risk decisioning.

Assurance
- Emission metrics e.g. absolute emissions, intensities, data quality scores.
- Sustainable finance.
- External disclosures.