


Watch the recording:
PwC's Gender Pay Report & Research Webinar
Our recent webinar explored the findings of our gender pay report and research. The session featured a panel of experts who deep-dived into impactful interventions and discussed how organisations can use pay fairness reporting to enhance brand and reputation, boost productivity and engagement, and reduce turnover.

While we explore the data and potential drivers behind this positive shift, our focus is on sustaining momentum - particularly as new UK and EU regulations broaden the scope of pay transparency reporting requirements. In this increasingly complex landscape, it’s essential that organisations ensure their actions turn insight into impact. This means tackling the root causes of pay gaps and addressing the barriers that shape the workforce. Not only will this help to continue reducing pay inequality, but it will also strengthen trust in employers and enhance a company’s brand and reputation.
By embedding insights from reporting into broader people strategies, organisations can foster inclusive cultures and better support their people - driving lasting, measurable change and delivering stronger business outcomes through improved performance, greater innovation and higher employee engagement.
10,701
Companies disclosed their gender pay gap
(compared to 10,408 last year)
11.2%
Median of reported mean pay gaps
(compared to 11.8% last year)
↓ 2.2%
Reduction in the mean pay gap since 2017
(compared to 13.4% in 2017)
Key trends
Our analysis shows a decrease of 0.6% in the mean pay gap from 11.8% in 2023/24 to 11.2% in 2024/25. The median hourly pay gap has decreased from 9.1% in 2023/24 to 8.6% in 2024/25. In the last few years, the pace of change appears to have accelerated, resulting in one of the biggest decreases since 2017/18, which may suggest that recent efforts by organisations are beginning to have a sustained impact.
The mean bonus gap has decreased by 0.3% from 29.6% in 2023/24 to 29.3% in 2024/25, and the median bonus gap has increased by 0.6% from 14.4% in 2023/24 to 15% in 2024/25. Bonus pay gaps are typically more volatile than hourly pay gaps, due to the performance related nature of most bonuses.
Changes in mean hourly pay gap by sector between 2023/24 - 2024/25
In 2024/25, the mean hourly pay gap decreased for organisations of all sizes, with the largest decrease of 1.1% for organisations with 5,000 to 19,999 employees.
Each year, the largest organisations (with 20,000 employees or more) have the lowest mean hourly pay gaps when compared to other sized organisations. This may be partly because the impact of leadership representation – which is often predominantly male and a major driver of pay gaps – is diluted across a much larger workforce.
The smallest organisations typically display higher levels of volatility in their pay gaps, as a single employee can have a more significant impact on overall average pay due to the smaller employee population. This can be seen more drastically between 2017/18- 2021/22 for organisations under 250 employees, however the last few years show more stable decreases, similar to other sized organisations.
Sector trends
The graph above outlines the cumulative changes in each sector’s mean hourly pay gap seen since the introduction of pay gap reporting in 2017/18. Encouragingly, the majority of sectors have shown decreases in the average mean pay gap, indicating progress towards pay equity.
The Financial Services sector has reported some of the most substantial reductions in mean pay gaps over this period. Within this sector, Real Estate, Banking and Investment have reduced their pay gaps by 14.9%, 8.6% and 8.2% respectively. While this progress is promising and reflects a growing commitment to change, it’s important to recognise that these sectors started from a higher baseline – historically reporting some of the largest pay gaps.
A small number of sectors, including Sport, Football and Support, have seen an increase in their reported gender pay gaps between 2017/18 and 2024/25. These sectors have historically been dominated by one gender, which can result in structural imbalances and make progress more challenging. As a result, these pay gaps tend to be more volatile and resistant to change.
Please note we have refined the methodology this year to classify companies into updated sectors, which may result in a shift in sector pay gaps reported in previous years. Additionally sector pay gaps may also vary due to differences in the number of companies that reported from 2017/18 to 2024/25.
Changes in mean pay gap by sector between 2023/24 and 2024/25
The sectors reporting the lowest pay gaps are Hospitality, Public Administration and Health. These sectors typically have a greater proportion of women overall, resulting in women often making up a more significant share of the senior workforce, and as a result, reducing the pay gap. Additionally, these sectors often rely on hourly wage structures rather than salaried roles, resulting in less variation in pay and contributing to smaller gaps.
On the other hand, our analysis shows sectors in Financial Services continue to report the largest gender pay gaps. This is reflective of the ongoing issues with gender equality within the sector. However, as previously explored, they have consistently shown progress in reducing their pay gap, with the largest decreases in the mean pay gap compared to last year experienced in Sport, Real Estate, Building Societies and Banking.
Please note we have refined the methodology this year to classify companies into updated sectors, which may result in a shift in sector pay gaps reported in previous years. Additionally sector pay gaps may also vary due to differences in the number of companies that reported from 2017/18 to 2024/25.
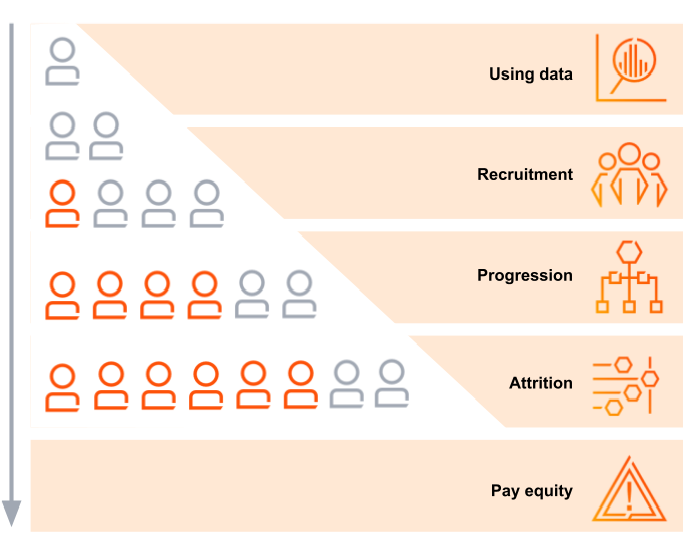
Interventions with impact
The primary driver of the gender pay gap is unequal representation across the workforce – typically with more women in junior roles and more men in senior positions. To close the gender pay gap sustainably, organisations need to focus on shifting this balance by using data to identify where representation is lacking and why. Targeted interventions across the three key levers – recruitment, progression and attrition – are essential. Beyond reducing pay gaps, these interventions also support broader business goals: improving workforce productivity and reducing turnover costs.
The gender pay gap isn’t just about pay, it’s about representation across the workforce.
You can read more about the most effective intervention strategies in the full report linked below.